Although primarily found in lofts, large apartments, commercial buildings, and other industrial spaces, you can easily borrow elements of industrial design when decorating your home. Born out of the Industrial Revolution, industrial’s unique style can create dynamic and visually striking interior spaces that feel clean, minimalist, and above all, modern.
What is Industrial Design?
The industrial style is based on the revolutionary concept of showcasing the building materials themselves as a design element. It creates an atmosphere akin to that of shipyards, places with reclaimed and repurposed materials, ports, etc. The common thread between all these places is openness. Industrial design prioritizes open spaces and a minimalist approach to filling the negative space. Whereas craftsman and cottage style homes were designed to evoke comfort, industrial design seeks to highlight architecture.
Image Source: Getty Images – Image Credit: vicnt
Industrial Design Elements
When you walk into an industrial space, you know it right away. The ceilings are higher than your typical single-family home. This stretches the scale and proportion of the space, which opens up new possibilities when decorating. Industrial spaces allow for vertical décor: ladders, vertically arranged gallery walls, and loft beds. A tenet of industrial design is the harnessing of natural light, so you’ll often see a preference for floor-to-ceiling windows. Features like weathered wood floors, bare ceilings, prevalent light bulbs, and structural beams help to tie industrial spaces together. These features are generally exposed, which helps the room from feeling too empty. Go-to materials for industrial décor include wood, aluminum, copper, steel, brick, and stone.
In modern and contemporary residential design, there has been a shift toward fusing elements of industrial design with other styles, such as mid-century modern or farmhouse, to create edgy yet comfortable living environments that look and feel sustainable. This is further proof that even if your home doesn’t have typical industrial features, you can blend in pieces of it to create something unique.
The following analysis of select counties of the Western Washington real estate market is provided by Windermere Real Estate Chief Economist Matthew Gardner. We hope that this information may assist you with making better-informed real estate decisions. For further information about the housing market in your area, please don’t hesitate to contact your Windermere Real Estate agent.
Regional Economic Overview
The post-COVID job recovery continues. Though data showed the number of jobs dropped in January, February saw gains that almost offset the jobs lost the prior month. As of February (March data is not yet available), the region had recovered all but 47,000 of the more than 300,000 jobs lost due to the pandemic. Of note is that employment levels in Grays Harbor, Thurston, San Juan, and Clallam counties are now above their pre-pandemic levels. In February, the regional unemployment rate rose to 4.1% from 3.7% in December. Although this may be disconcerting, an improving economy has led more unemployed persons to start looking for a job, which has pushed the jobless rate higher. I expect the regional economy to continue expanding as we move into the spring and summer, with a full job recovery not far away.
Western Washington Home Sales
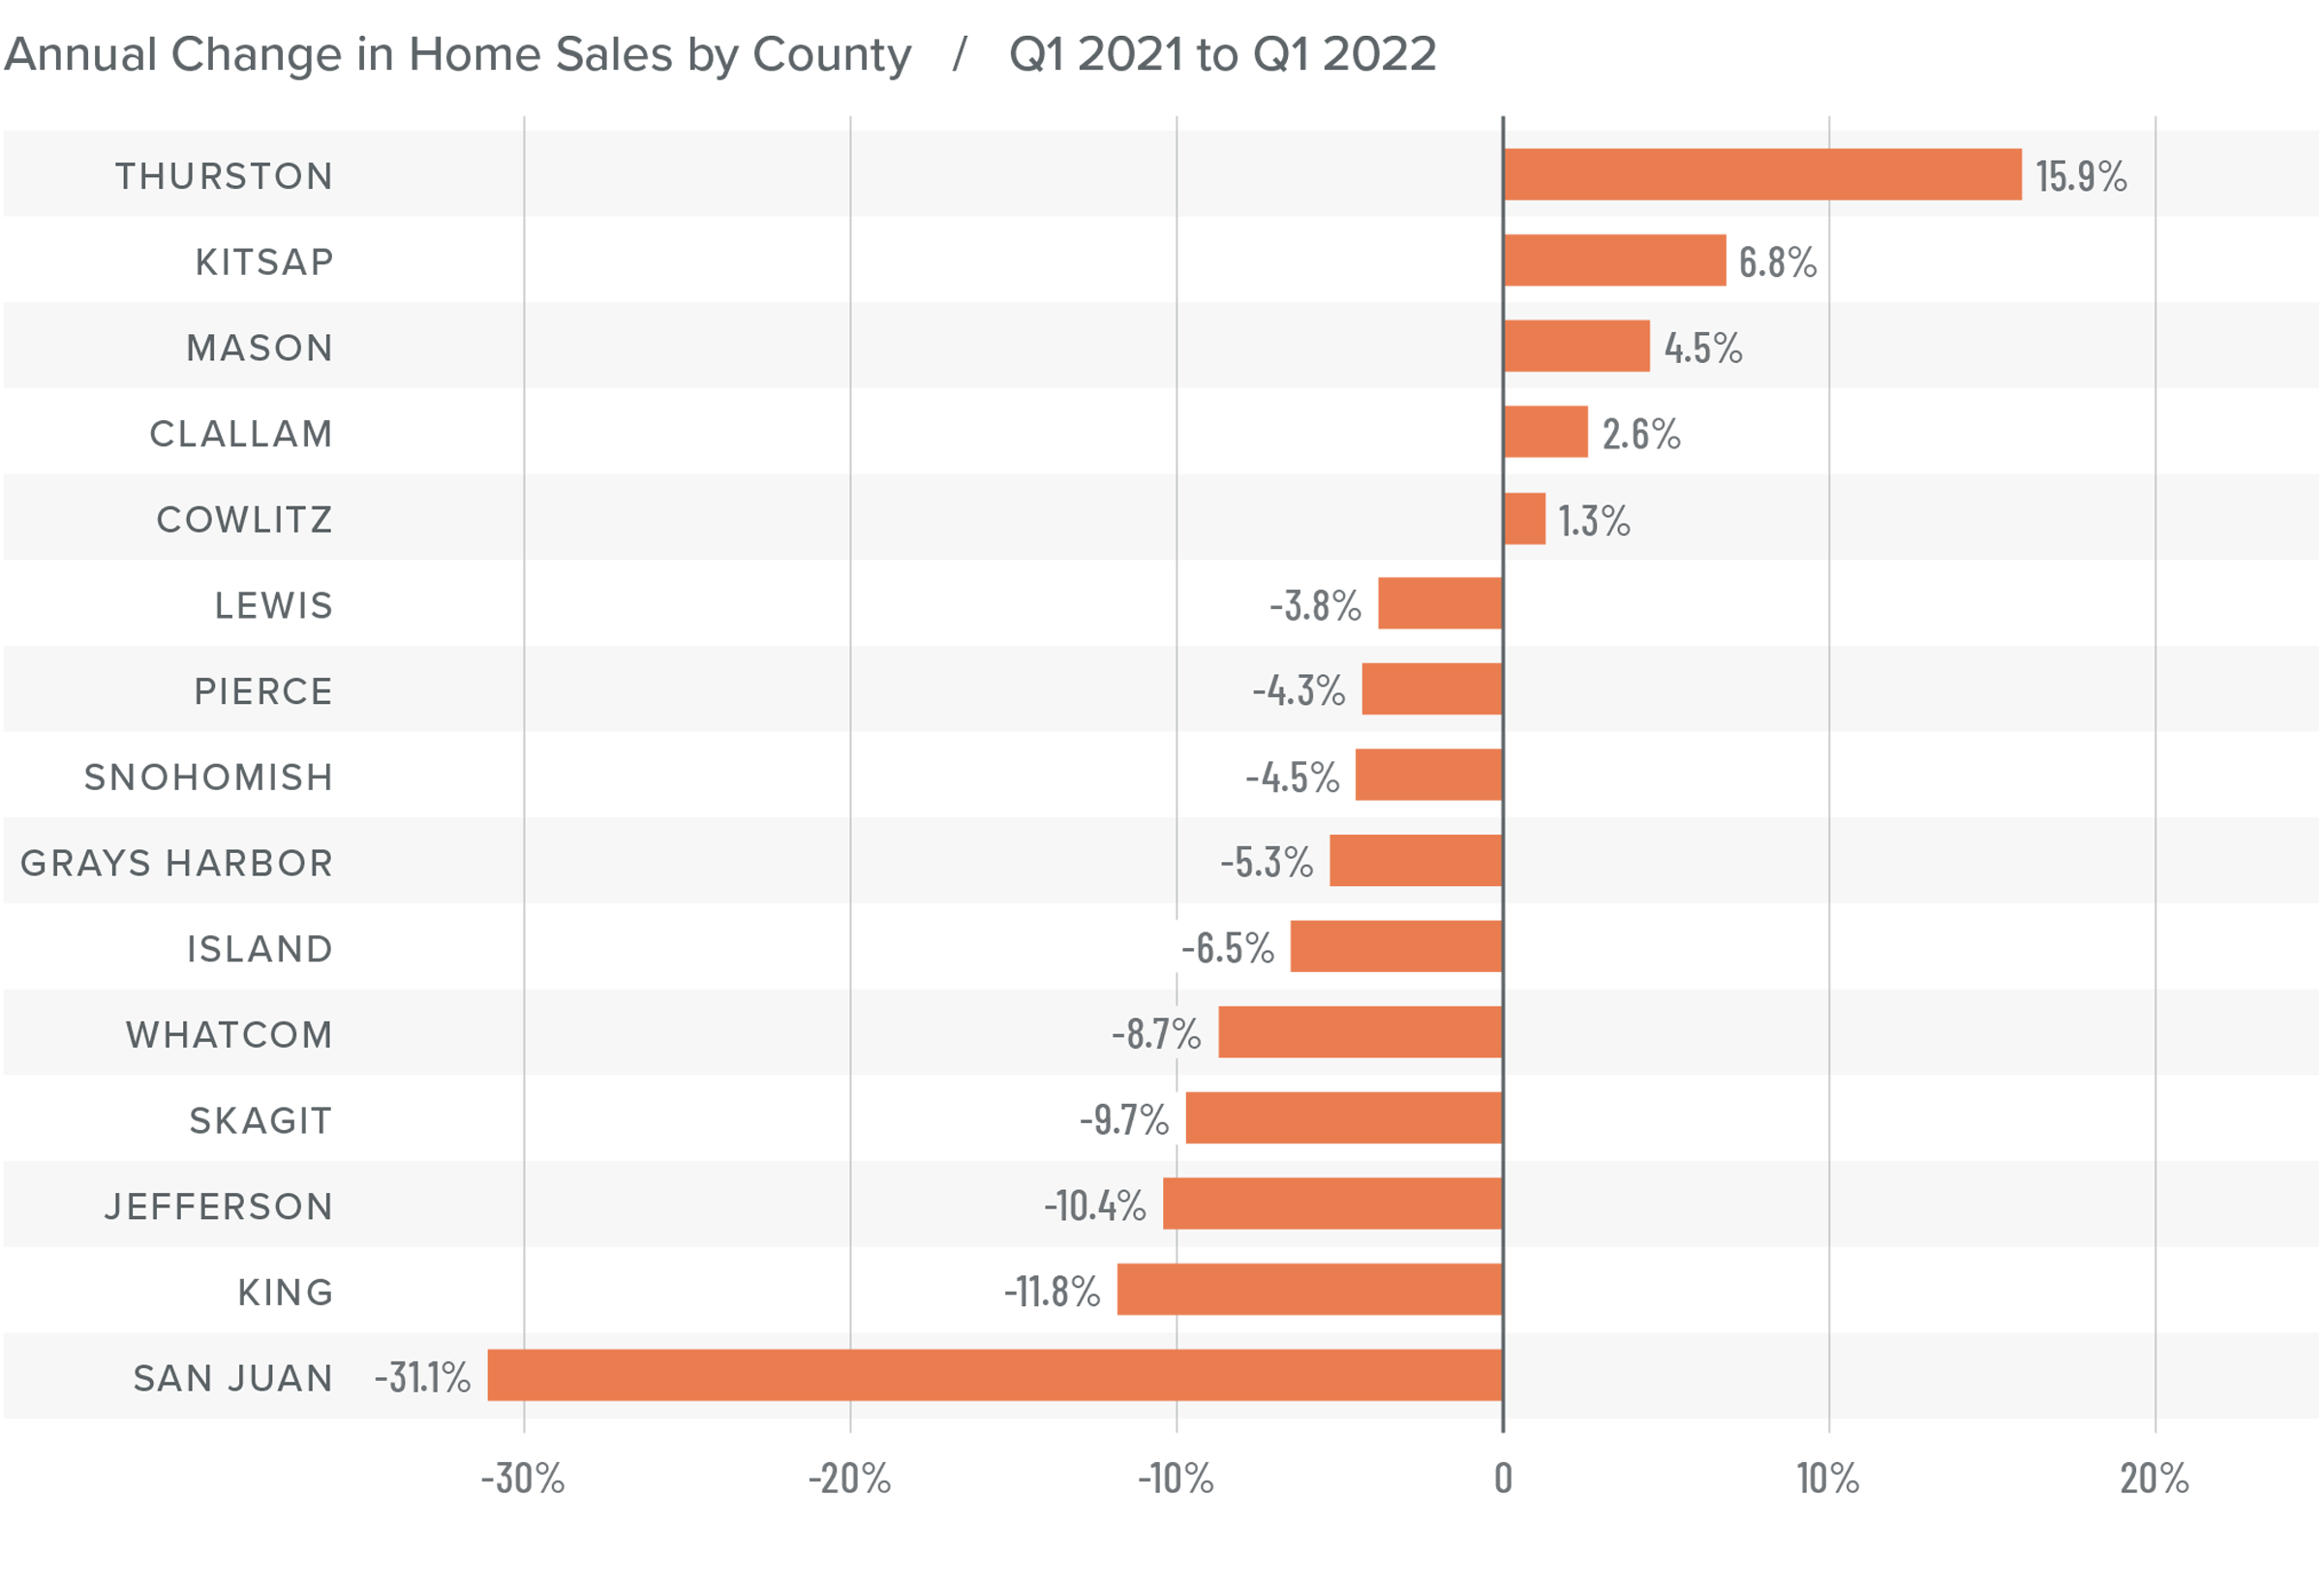
❱ In the first quarter of 2022, 15,134 homes sold, representing a drop of 5.8% from the same period a year ago, and down 31.7% from the fourth quarter.
❱ Yet again, supply-side constraints limited sales. Every county except Snohomish showed lower inventory levels than a year ago.
❱ Sales grew in five counties across the region but were lower across the balance of the counties contained in this report. Compared to the fourth quarter, sales were lower across all market areas.
❱ The ratio of pending sales (demand) to active listings (supply) showed pending sales outpacing listings by a factor of 6.7. Clearly, the significant jump in mortgage rates in the first quarter has not yet impacted demand. Rather it appears to have stimulated buyers partly due to FOMO (Fear of Missing Out)!
Western Washington Home Prices
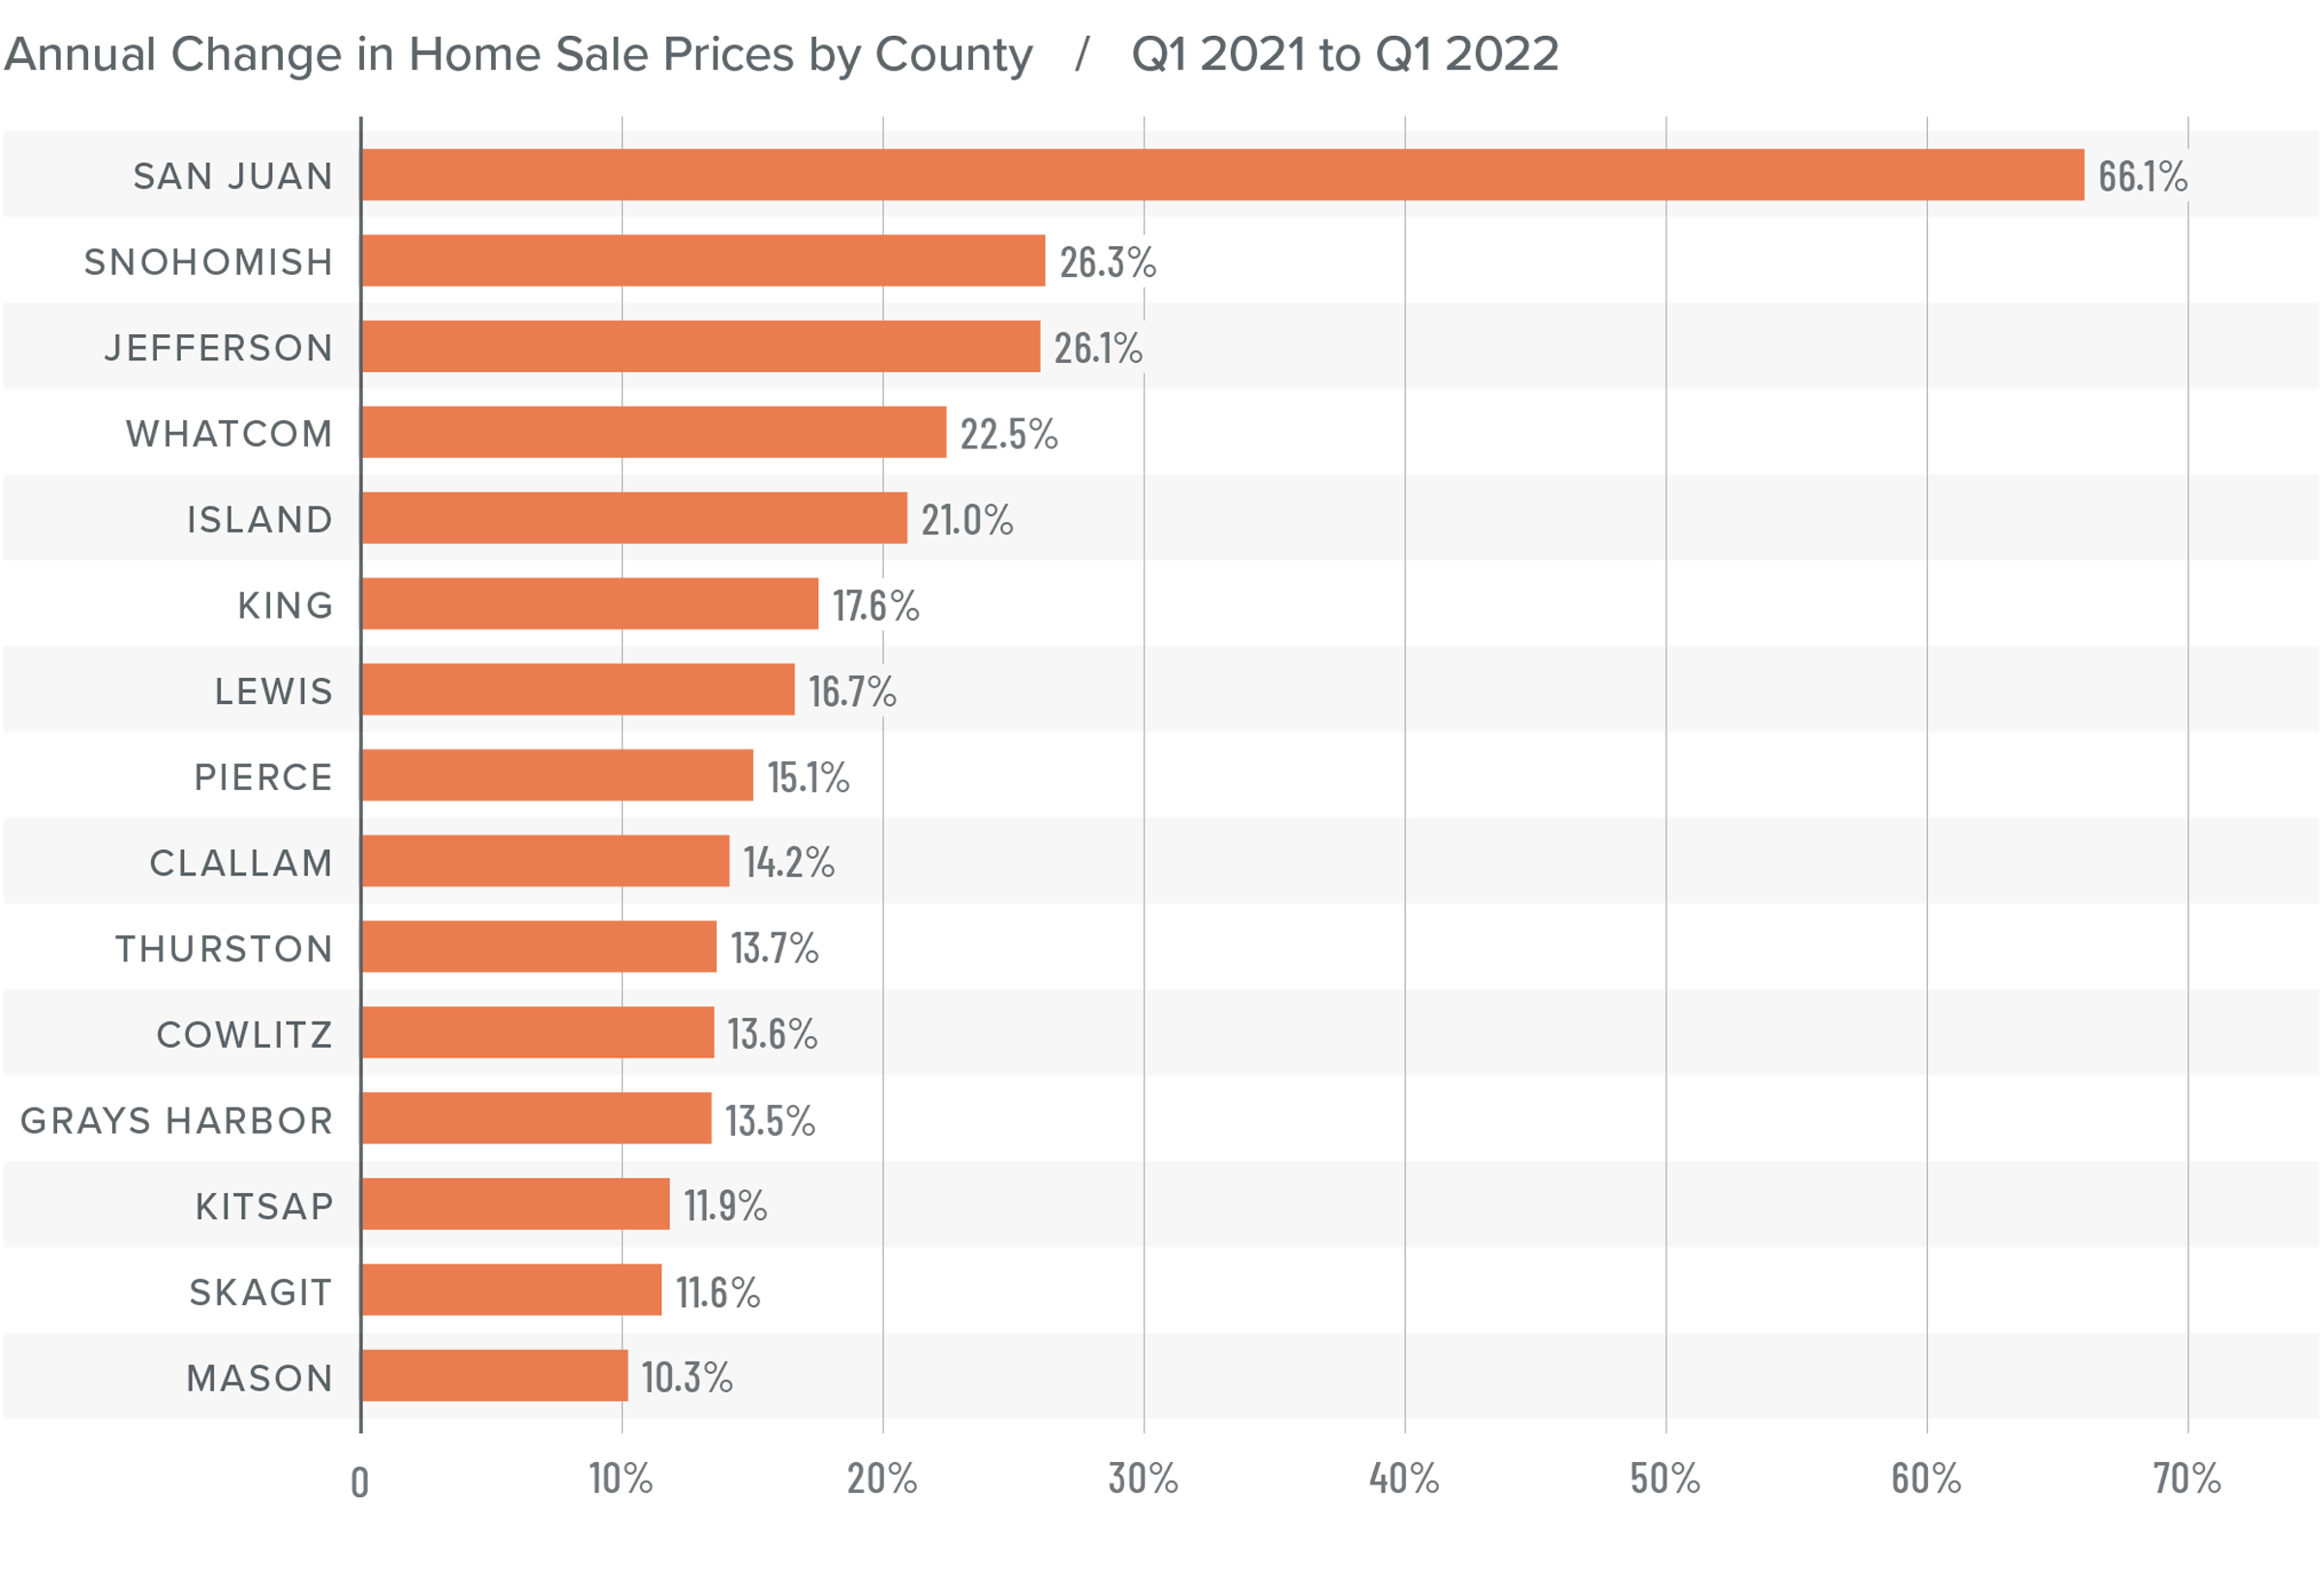
❱ Although financing costs have jumped, this has yet to prove to be an obstacle to buyers, as prices rose 16.4% year-over-year to an average of $738,152. Naturally, there is a lag between rates rising and any impact on market prices. It will be interesting to see what, if any, effect this has in the next quarter’s report.
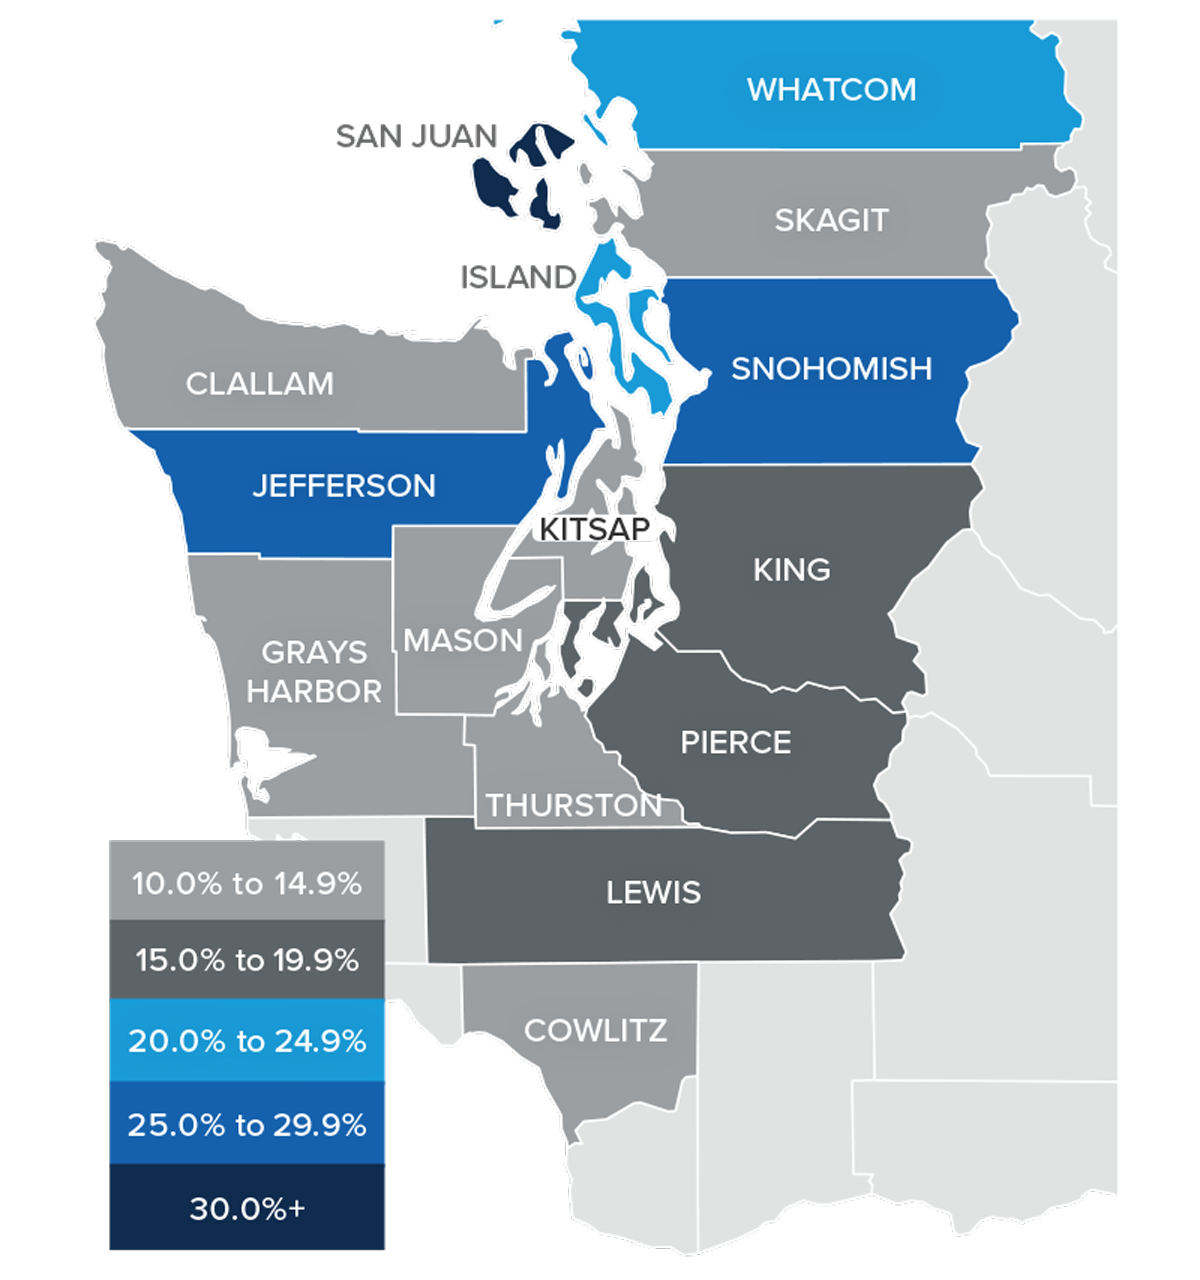
❱ Compared to the same period a year ago, price growth was again strongest in San Juan County, but all markets saw prices rising more than 10% from a year ago.
❱ Relative to the final quarter of 2021, all but Kitsap (-2.7%), Mason (-1.5%), Skagit (-1.8%), Jefferson (-6.3%), and Clallam (-0.1%) counties saw home prices rise.
❱ The market remains supply starved. While increases in “new” listings suggest that more choice is coming to market, it remains insufficient to meet demand.
Mortgage Rates
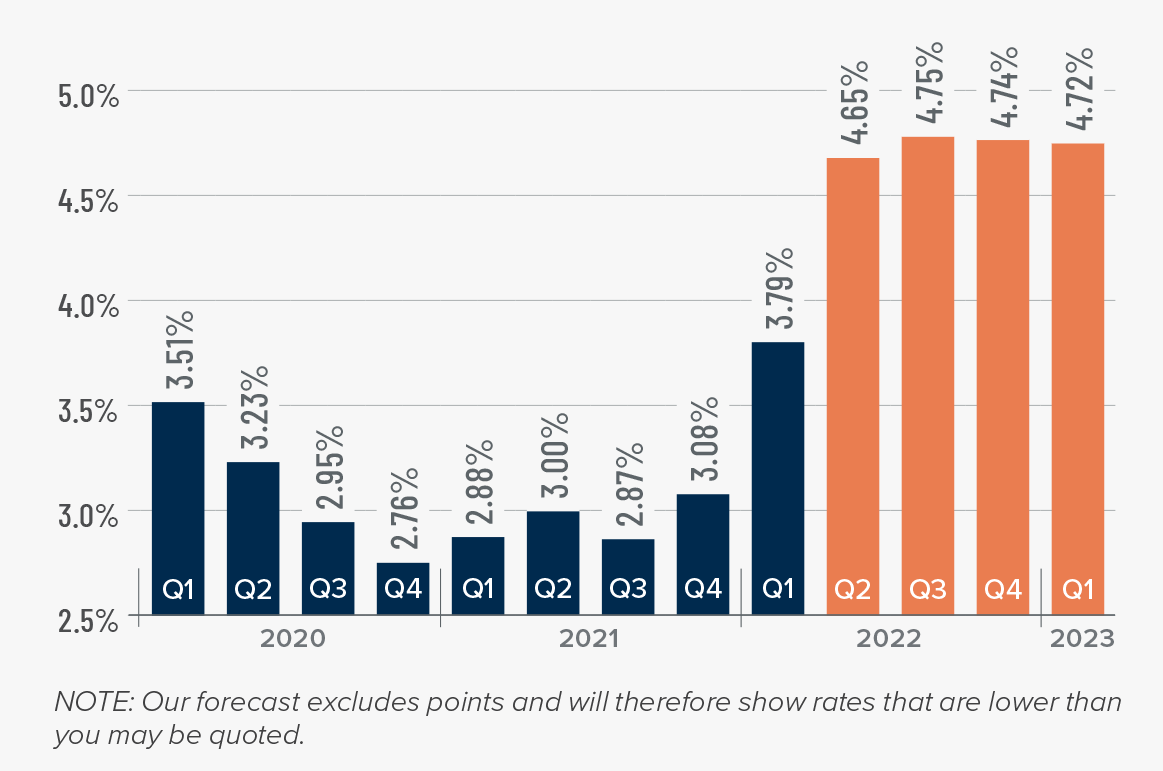
Average rates for a 30-year conforming mortgage were 3.11% at the end of 2021, but since then have jumped over 1.5%—the largest increase since 1987. The surge in rates is because the market is anticipating a seven- to eight-point increase from the Federal Reserve later this year.
Because the mortgage market has priced this into the rates they are offering today, my forecast suggests that we are getting close to a ceiling in rates, and it is my belief that they will rise modestly in the second quarter before stabilizing for the balance of the year.
Western Washington Days on Market
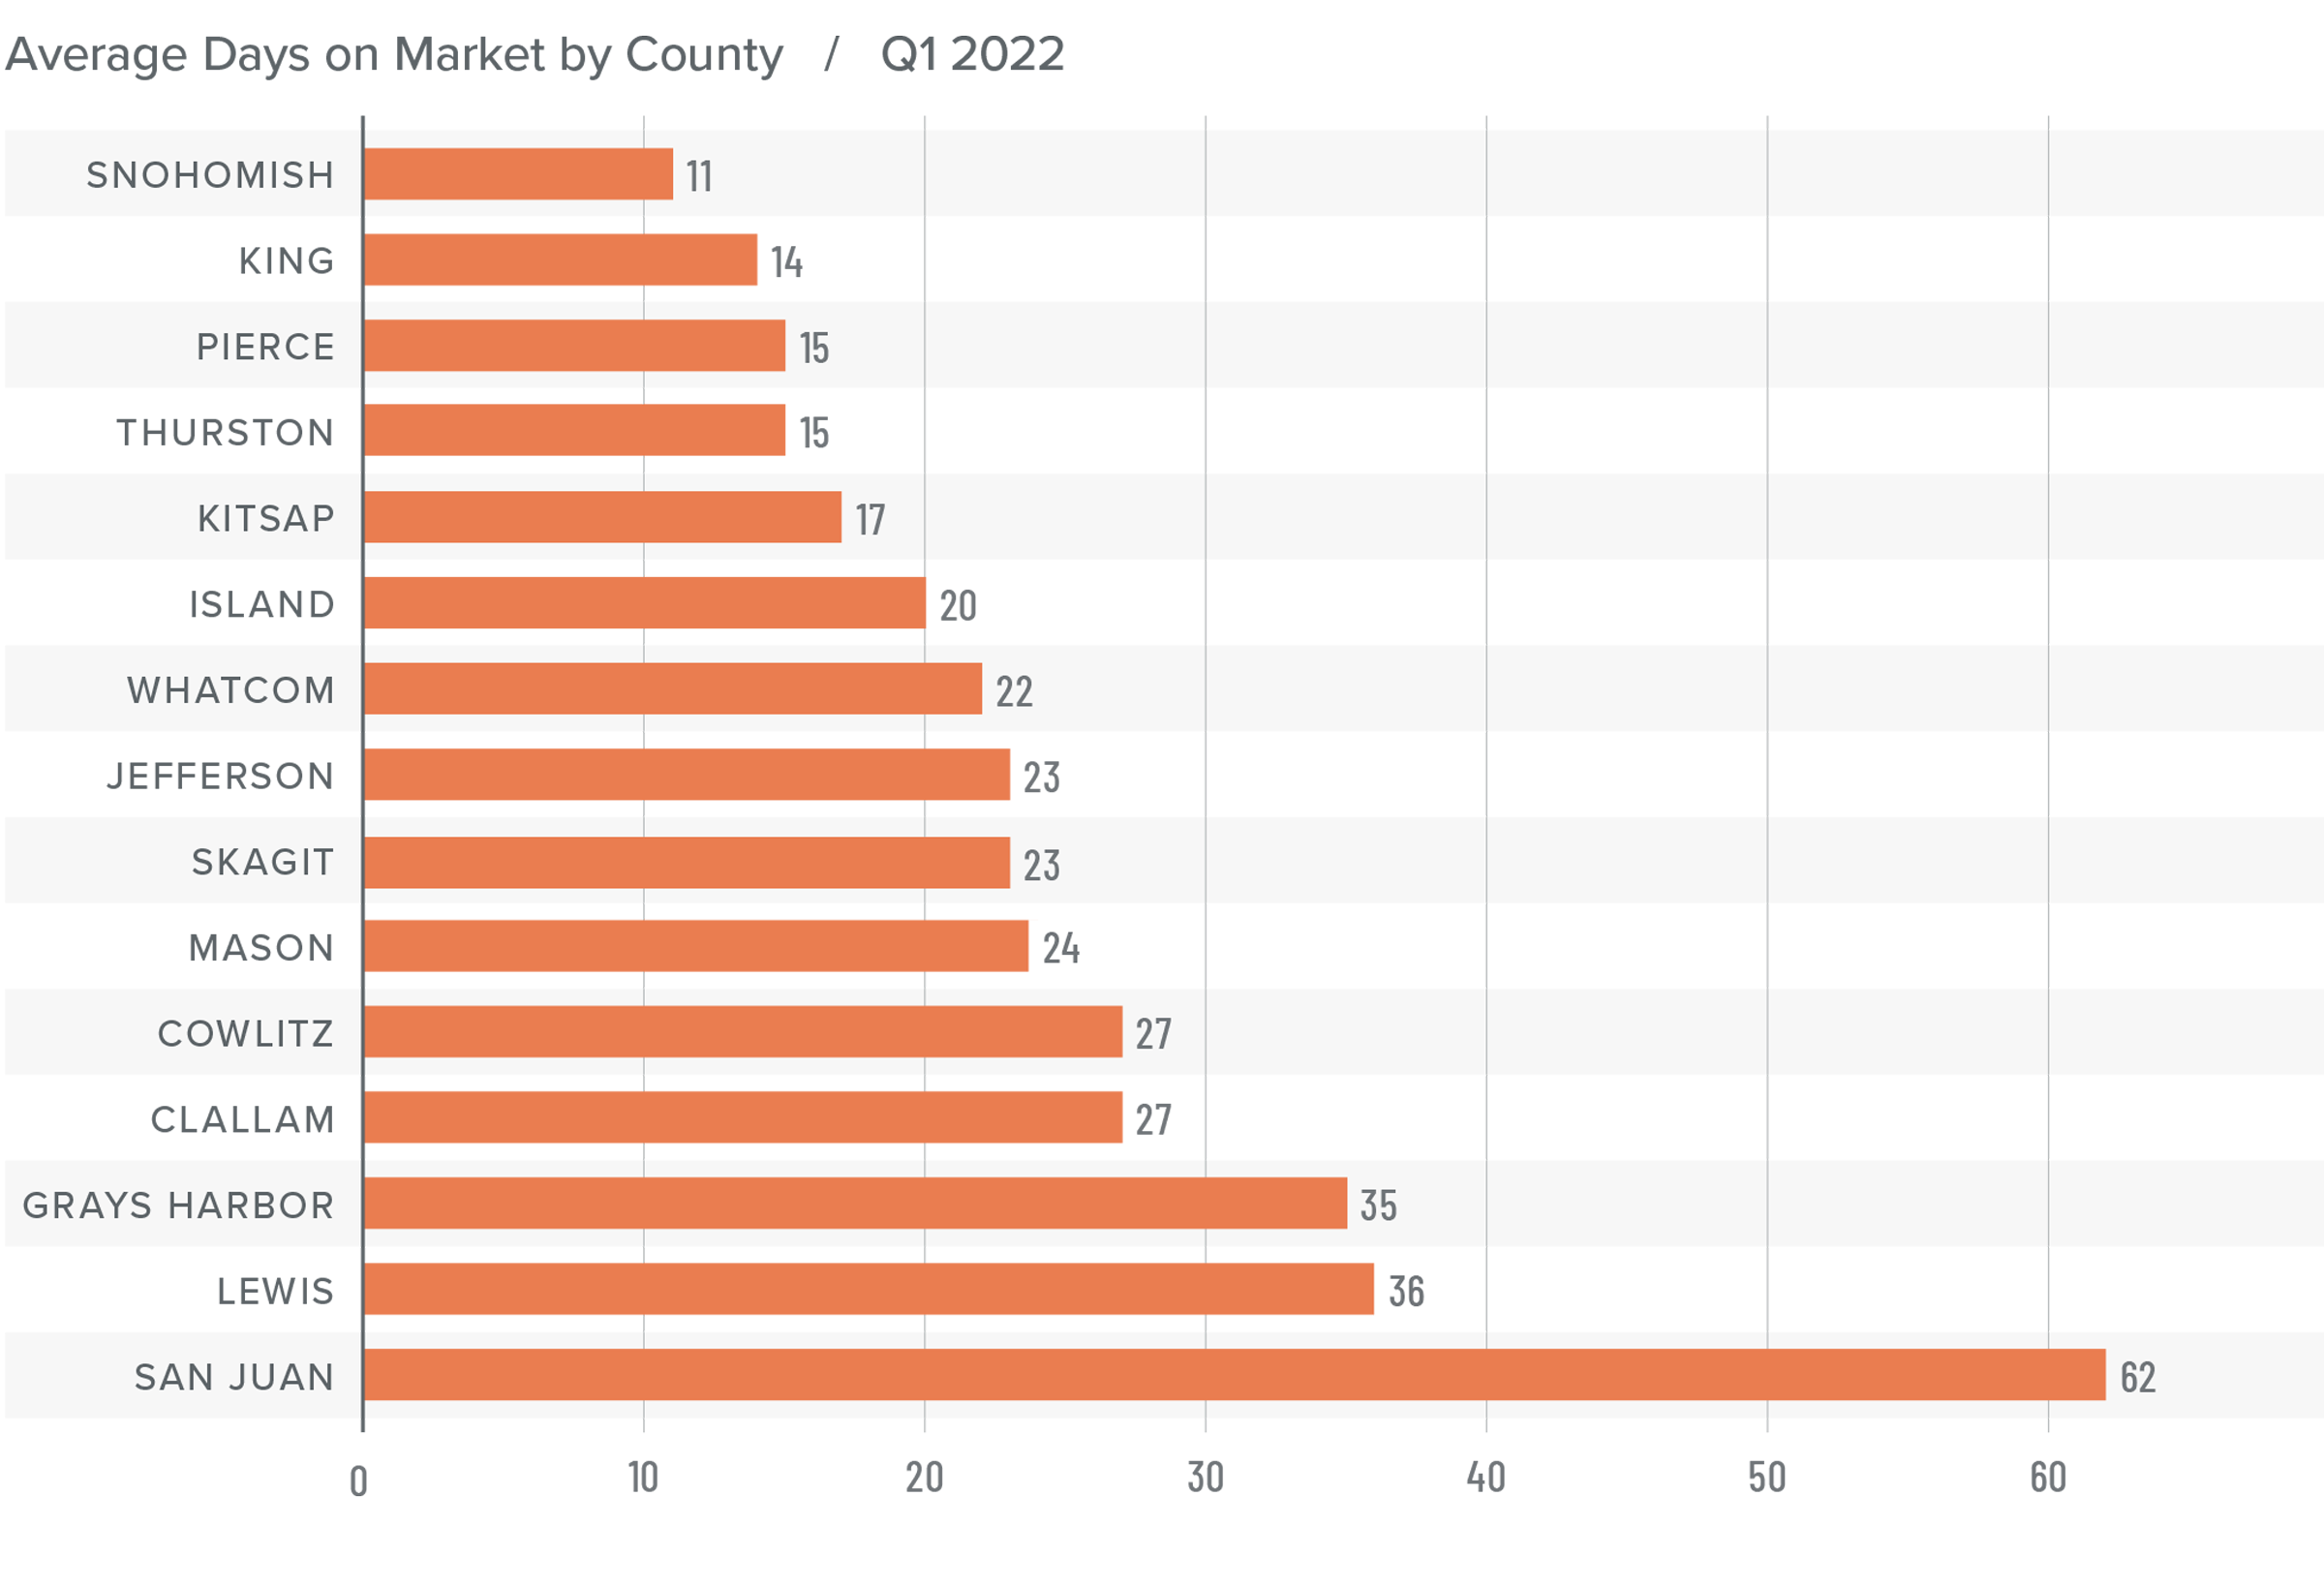
❱ It took an average of 25 days for a home to go pending in the first quarter of 2022. This was 4 fewer days than in the same quarter of 2020, but 2 days more than in the fourth quarter of 2021.
❱ Snohomish, King, and Pierce counties were the tightest markets in Western Washington, with homes taking an average of 11 to 15 days to sell. The greatest drop in market time compared to a year ago was in San Juan County, where it took 23 fewer days for homes to sell.
❱ All but five counties saw average time on market drop from the same period a year ago, but the markets where it took longer to sell a home saw the length of time increase only marginally.
❱ Quarter over quarter, market time dropped in Snohomish, King, and Pierce counties. Jefferson and Clallam counties also saw modest improvement. In the balance of the region the length of time a home was on the market rose, but seasonality undoubtedly played a part.
Conclusions
This speedometer reflects the state of the region’s real estate market using housing inventory, price gains, home sales, interest rates, and larger economic factors.
The numbers have yet to indicate that demand is waning amid rising interest rates, but this is sure to become a greater factor as we move into the spring. A leading indicator I pay attention to is changes to list prices and, in most counties, these continue to increase. This suggests that sellers remain confident they will be able to find a buyer even in the face of higher borrowing costs. If this pace of increase starts to soften, it may be an indication of an inflection point, but it does not appear to be that way yet.
Given all the factors discussed above, I have decided to leave the needle in the same position as the last quarter. The market still heavily favors sellers, but if rates rise much further, headwinds will likely increase.
About Matthew Gardner
As Chief Economist for Windermere Real Estate, Matthew Gardner is responsible for analyzing and interpreting economic data and its impact on the real estate market on both a local and national level. Matthew has over 30 years of professional experience both in the U.S. and U.K.
In addition to his day-to-day responsibilities, Matthew sits on the Washington State Governors Council of Economic Advisors; chairs the Board of Trustees at the Washington Center for Real Estate Research at the University of Washington; and is an Advisory Board Member at the Runstad Center for Real Estate Studies at the University of Washington where he also lectures in real estate economics.
This video is the latest in our Monday with Matthew series with Windermere Chief Economist Matthew Gardner. Each month, he analyzes the most up-to-date U.S. housing data to keep you well-informed about what’s going on in the real estate market.
Hello there, I’m Windermere’s Chief Economist Matthew Gardner, and welcome to this month’s episode of Monday with Matthew. With home prices continuing to defy gravity, mortgage rates spiking, the Fed raising interest rates significantly, a yield curve that is just keeping its nose above water, and some becoming vocal about the possibility that we are going to enter a recession sooner rather than later, it’s not at all surprising that many of you have been asking me whether the housing market is going to pull back significantly, and a few of you have asked whether we aren’t in some sort of “bubble” again.
Because this topic appears to be giving many of you heartburn, I decided that it’s a good time to reflect on where the housing market is today and give you my thoughts on the impact of rising mortgage rates on what has been an historically hot market.
The Current State of the U.S. Housing Market
Home Sale Prices
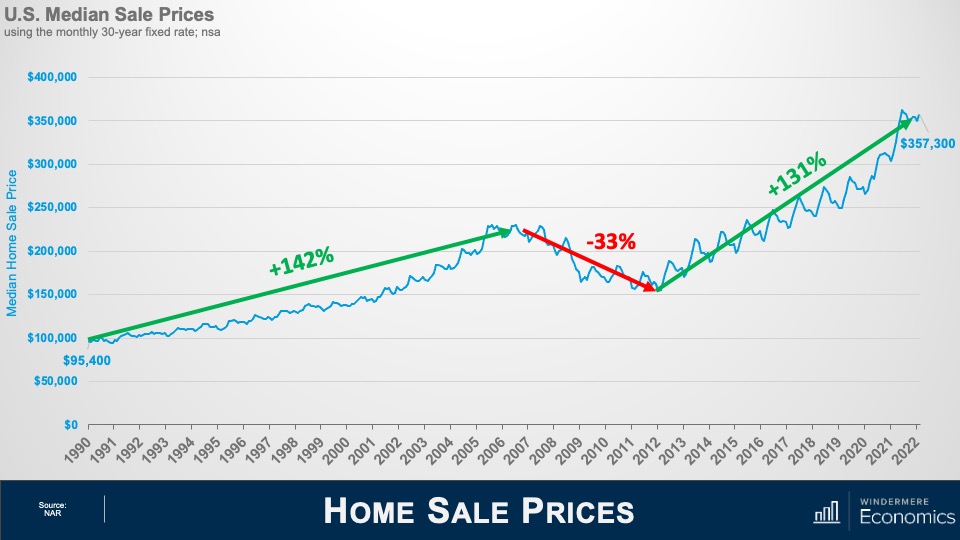
As usual, a little perspective. Between 1990 and the pre-bubble peak in 2006, home prices rose by 142%, which was a pretty impressive annual increase of 5.6% over a 16 1/2-year period. When the market crashed, prices dropped by 33%, but from the 2012 low to today, prices have risen by 131%, or at an even faster annual rate of 8.6% over a shorter period of time—10 years.
You may think that prices rising at an annual rate that exceeds the pace seen before the market crash is what has some brokers and home buyers concerned, but that really isn’t what has many people scared. It’s this.
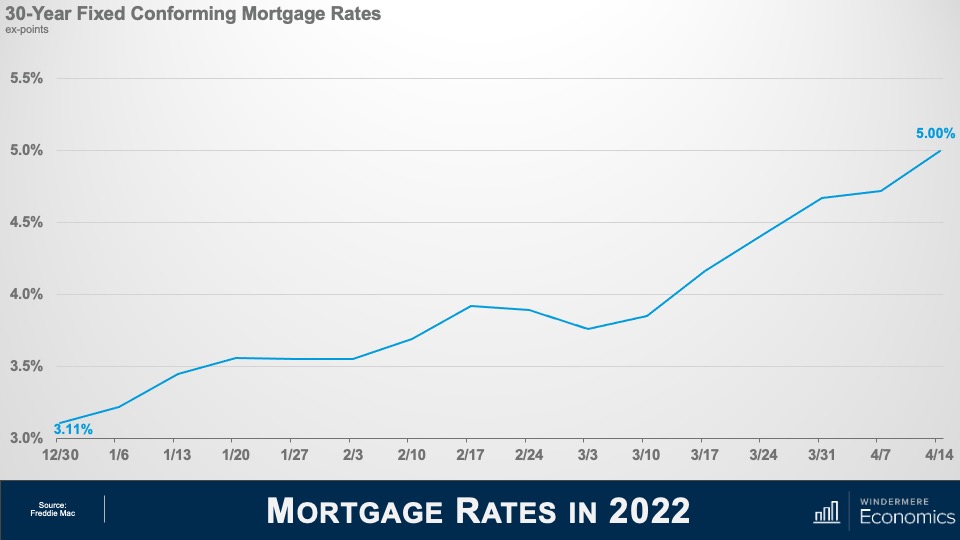
Mortgage Rates in 2022
At the start of 2022, the average 30-year fixed mortgage rate was just a little above 3%. But, over a brief 15-week period, they have skyrocketed to 5%. This has led some to worry that the market is about to implode. Of course, nobody can say that the run-up in home prices hasn’t been phenomenal over the past few years, and it’s certainly human nature to think that “what goes up, must come down,” but is there really any reason to panic? I think not, and to explain my reasoning, let’s look back in time to periods when rates rose significantly and see how increasing mortgage rates impacted the marketplace.
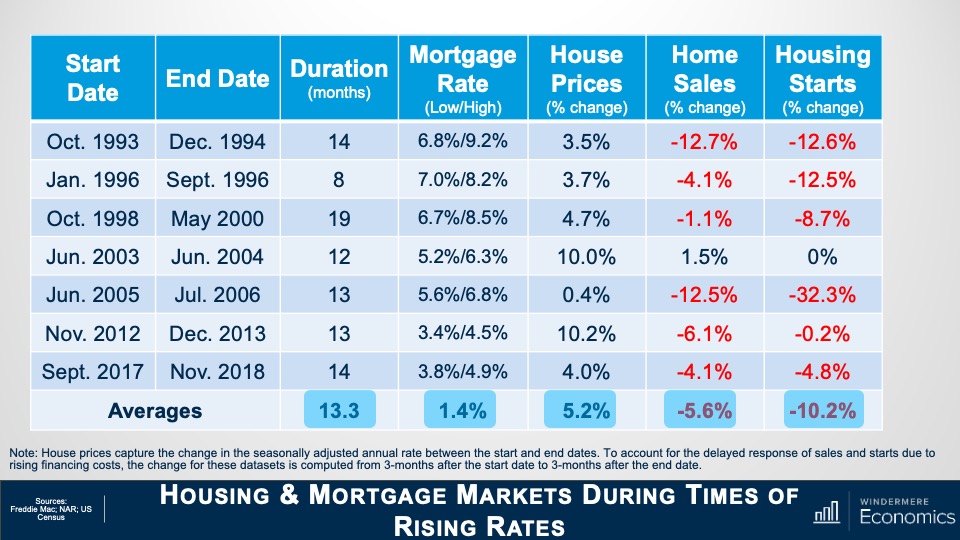
Housing and Mortgage Markets During Times of Rising Rates
This table shows seven periods over the past 30 years when mortgage rates rose significantly. On average, rates trended higher for just over a year before pulling back, and the average increase was 1.4%. But now look at how it impacted home prices: it really didn’t. On average, during these periods of rising financing costs, home prices still rose by just over 5%. Clearly, not what some might have expected. But there were some negatives from mortgage rates trending higher, and these came in the form of lower sales in all but one period and new housing starts also pulled back.
So, if history is any indicator, the impact of the current jump in mortgage rates is likely to be seen in the form of lower transactions rather than lower prices. And this makes sense. Although rising financing costs puts additional pressure on housing affordability, what people don’t appear to think about is that mortgage rates actually tend to rise during periods of economic prosperity. And what does a flourishing economy bring? That’s right. Rising wages. Increasing incomes can certainly offset at least some of the impacts of rising mortgage rates.
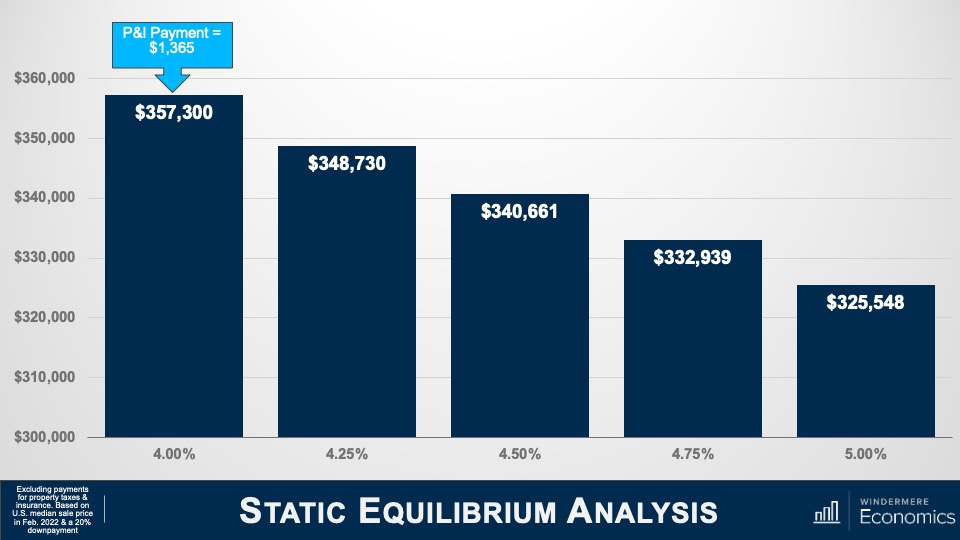
Static Equilibrium Analysis – 1/3
To try and explain this, I’m using the median US sale price in February of this year, assuming a 20% down payment and the mortgage rate of 4%. And you can see that the monthly P&I payment would be $1,365. But as mortgage rates rise, and if buyers wanted to keep the same monthly payment, then they would have to buy a cheaper home. Using a rate of 5%, a buyer could afford a home that was 9% cheaper if they wanted to keep the payment the same as it would have been if rates were still at 4%.
But, as I mentioned earlier, an expanding economy brings higher wages, and this is being felt today more than usual, given the worker shortage that exists and businesses having to raise compensation. Average weekly wages have risen by over five-and-a-half percent over the past year—well above the pre-pandemic average of two-and-a-half percent. Although increasing incomes would not totally offset rising mortgage rates, it does have an impact.
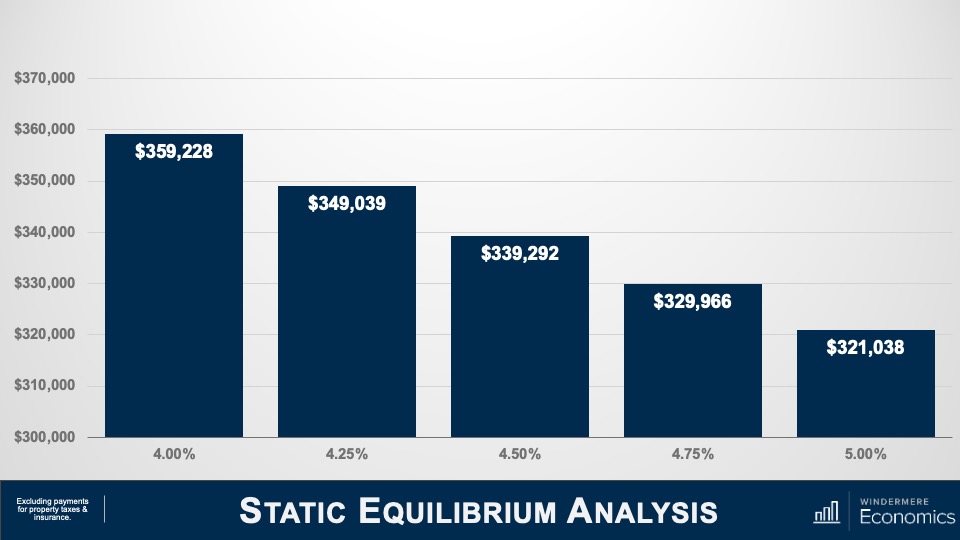
Static Equilibrium Analysis – 2/3
To demonstrate this, let’s use the U.S. average household income of $70,611. Assuming that they’ve put aside 20% of their gross income for a down payment, they could afford a home priced just under $360,000 if mortgage rates were at 4%. As rates rise—and assuming that their income doesn’t—their buying power is reduced by over 10%, or just over $38,000.
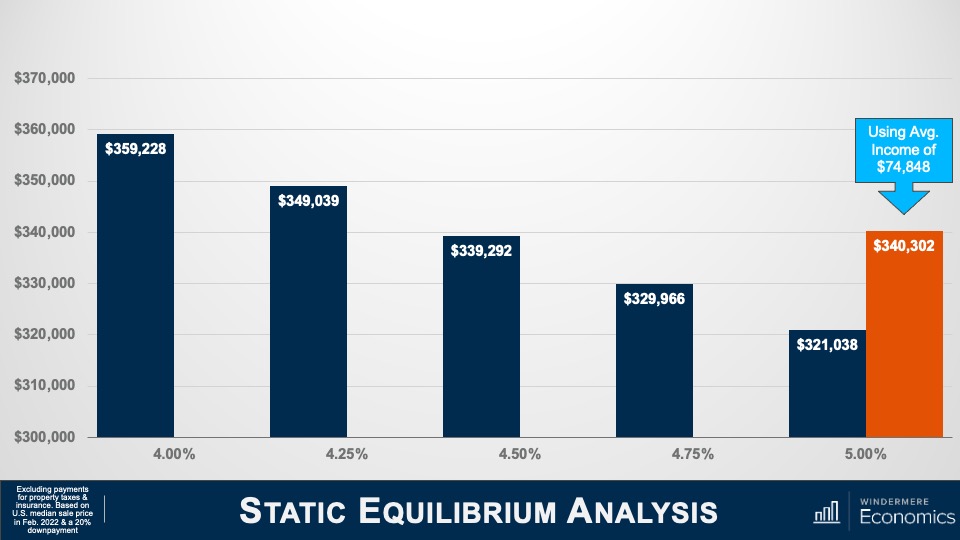
Static Equilibrium Analysis – 3/3
But if we believe that incomes will rise, then the picture looks very different. Assuming wages rise by 6%, their buying power drops by just 5% if rates rose from 4% to 5%, or a bit less than $19,000.
Although rates have risen dramatically in a short period, because they started from an historic low, the overall impacts are not yet very significant. If history is any indicator, mortgage rates increasing are likely to have a more significant impact on sales, but a far smaller impact on prices.
But there are other factors that come into play, too. Here I’m talking about demand. The only time since 1968 that home prices have dropped on an annualized basis was in 2007 through 2009 and in 2011, and this was due to a massive increase in the supply of homes for sale. When supply exceeds demand, prices drop.
So, how is it different this time around? Well, we know that the supply glut that we saw starting to build in mid-2006 was mainly not just because households were getting mortgages that, quite frankly, they should never have gotten in the first place, but a very large share held adjustable rate mortgages which, when the fixed interest rate floated, they found themselves faced with payments that they could not afford. Many homeowners either listed their homes for sale or simply walked away.
Although it’s true that over the past two or so months more buyers have started taking ARMs as rates rose, it’s not only a far smaller share than we saw before the bubble burst, but down payments and credit quality remained far higher than we saw back then.
So, if we aren’t faced with a surge of inventory, I simply don’t see any reason why the market will see prices pull back significantly. But even if we do see listing activity increase, I still anticipate that there will be more than enough demand from would-be buyers. I say this for several reasons, the first of which is inflation.
What a lot of people aren’t talking about is the proven fact that owning real estate is a significant hedge against rising inflation. You see, most buyers have a mortgage, and a vast majority use fixed-rate financing. This is the hedge because even as consumer prices are rising, a homeowner’s monthly payments aren’t. They remain static and, more than that, their monthly payments actually become lower over time as the value of the dollar diminishes. Simply put, the value of a dollar in—let’s say 2025—will be lower than the value of a dollar today.
But this isn’t the only reason that inflation can actually stimulate the housing market. Home prices historically have grown at a faster pace than inflation.
Hedge Against Inflation
This chart looks at the annual change in total CPI going back to 1969. Now let’s overlay the annual change in median U.S. home prices over the same time period. Other than when home prices crashed with the bursting of the housing bubble, for more than fifty years home price growth has outpaced inflation. And this means we are offsetting high consumer prices because home values are increasing at an even faster rate.
But inflation has additional impacts on buyers. Now I’m talking about savings. As we all know, the interest paid on savings today is pretty abysmal. In fact, the best money market accounts I could find were offering interest rates between 0.5% and 0.7%. And given that this is significantly below the rate of inflation, it means that dollars saved continue to be worth less and less over time while inflation remains hot.
Now, rather than watching their money drop in value because of rising prices, it’s natural that households would look to put their cash to work by investing in assets where the return is above the rate of inflation—meaning that their money is no longer losing value—and where better place to put it than into a home.
Housing as a Hedge Against Inflation
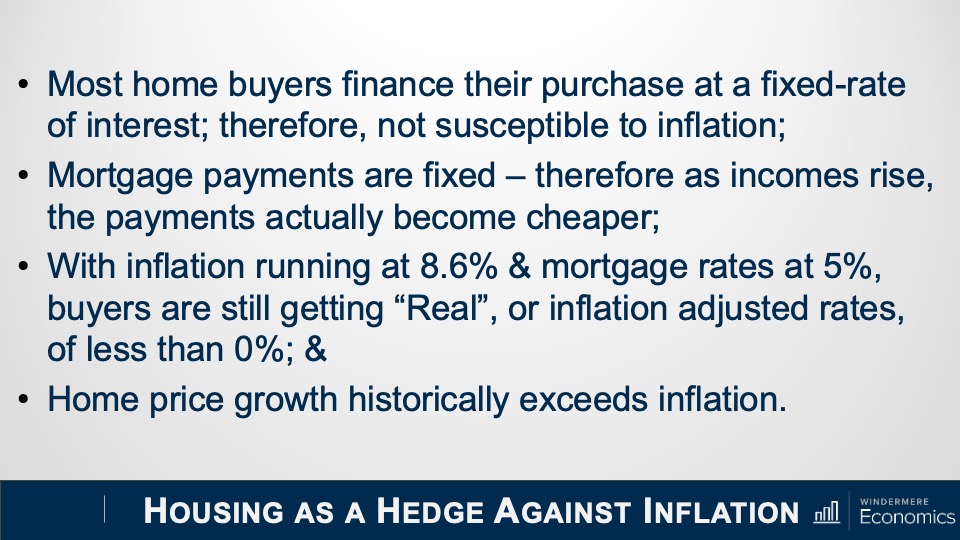
So, the bottom line here is that inflation supports demand from home buyers because:
Most are borrowing at a fixed rate that will not be impacted by rising inflation
Monthly payments are fixed, and these payments going forward become lower as incomes rise, unlike renters out there who continue to see their monthly housing costs increase
With inflation at a level not seen since the early 1980s, borrowers facing 5% mortgage rates are still getting an amazing deal. In fact, by my calculations, mortgage rates would have to break above 7% to significantly slow demand, which I find highly unlikely, and
If history holds true, home price appreciation will continue to outpace inflation
Demand appears to still be robust, and supply remains anemic. Although off the all-time low inventory levels we saw in January, the number of homes for sale in March was the lowest of any March since record keeping began in the early 1980’s.
But even though I’m not worried about the impact of rates rising on the market in general, I do worry about first-time buyers. These are households who have never seen mortgage rates above 5% and they just don’t know how to deal with it! Remember that the last time the 30-year fixed averaged more than 5% for a month was back in March of 2010!
And given the fact that these young would-be home buyers have not benefited from rising home prices as existing homeowners have, as well as the fact that they are faced with soaring rents, making it harder for them to save up for a down payment on their first home, many are in a rather tight spot and it’s likely that rising rates will lower their share of the market.
So, the bottom line as far as I am concerned is that mortgage rates normalizing should not lead you to feel any sort of panic, and that current rates are highly unlikely to be the cause of a market correction.
And I will leave you with this one thought. If you agree with me that a systemic drop in home prices has to be caused by a significant increase in supply, and that buyers who are currently taking out adjustable-rate mortgages are more qualified, and therefore able to manage to refinance their homes when rates do revert at some point in the future, then what will cause listings to rise to a point that can negatively impact prices?
It’s true that a significant increase in new home development might cause this, but that is unlikely. And as far as existing owners are concerned, I worry far more about a prolonged lack of inventory. I say this for one very simple reason and that is because a vast majority off homeowners either purchased when mortgage rates were at or near their historic lows, or they refinanced their current homes when rates dropped.
And this could be the biggest problem for the market. Even if rates don’t rise at all from current levels, I question how many owners would think about selling if they were to lose the historically low mortgage rates that they have locked into. It is quite possible that for this one reason, we may experience a tight housing market for several more years.
In honor of Windermere’s 50th anniversary, the Windermere Foundation has set a goal to reach $50 million in total donations raised by the end of 2022. At the end of last year, the Foundation surpassed $46 million in total donations, leaving a nearly $4 million gap to eclipse the $50 million mark. Through the fundraising efforts of offices across the Windermere footprint, 2022 is off to a strong start. Here are a few highlights from early 2022.
Windermere Northern Colorado
Windermere Northern Colorado has burst out the gate this year, organizing multiple fundraising events and supporting multiple local organizations throughout the early months of 2022. ChildSafe, based in Fort Collins, CO, provides children with responsive treatment, education, and recovery from child abuse. The Windermere office has supported ChildSafe in the past and wanted to continue to do so in 2022, donating $10,000 to them in February to help heal the trauma experienced by local victims of child abuse. In March, the office directed its giving efforts to the Weld County School District, with the goal of helping local children and families struggling with homelessness. Windermere Northern Colorado’s donation of $5,000 allowed the school district to purchase grocery gift cards for local families and students in need.
Pictured left to right: Weld RE-4 School District Director of Exceptional Student Services JonPaul Burden, Meaghan Nicholl, Elizabeth Dolton.
Windermere Utah
For the agents, owners, and staff at Windermere Utah, The Make-A-Wish Foundation has a special place in their hearts. Supporting children in need in their community has been a focal point of the office’s giving over the years, so when looking to kickstart their 2022 giving, Make-A-Wish was a natural fit. The office donated $5,000, which will go toward the organization’s ability to grant another child’s wish.
Windermere Coast Offices (Oregon)
The Windermere Coast Offices of Gearhart and Cannon Beach have made it a point to support the aspirations and success of women in their community. They’ve been loyal supporters of the Astoria, OR branch of the American Association of University Women (AAUW) since learning about the organization years ago. AAUW provides scholarships for women who may not otherwise have the resources to pursue and succeed in their educational and vocational goals.
Whether you are buying or selling a home, mold is something to be mindful of. Health concerns and potential damage make mold a red flag for buyers. Even if you’re not planning to sell any time soon, taking care of mold problems now can prevent even larger and more costly issues in the future. Contrary to what some people think, mold is not a geographic problem—it can occur anywhere, no matter where you live. Here is some basic information about mold and how to deal with it.
What is mold?
Molds are microscopic organisms that are found virtually everywhere indoors and outdoors. There are thousands of different kinds of mold. Their natural function is to help break down dead materials such as stumps and leaves so the nutrients can be used by the environment. For molds to grow, they need two things: an organic food source—such as leaves, wood, paper, or dirt—and moisture.
Mold Causes Damage
Mother Nature uses mold to decompose plant material. Unfortunately, when present indoors, it can be equally destructive. Mold growth can damage furnishings, such as carpets, couches, and cabinets. If it goes undetected or neglected, it can also cause serious damage to walls and structural elements in your home.
Mold is present everywhere, and most people tolerate exposure with no adverse effects. If allowed to spread, however, it may cause problems. As molds grow, they release thousands of tiny spores that travel through the air. When inhaled in large enough amounts, these spores may increase the risk of adverse health effects in some people, particularly respiratory problems. A less-common strain of mold called “black mold” can be particularly troublesome to those who are especially sensitive.
No matter your local climate, your home is vulnerable to mold. There are many sources of mold problems, from faulty air conditioners to poorly positioned sprinkler systems. Here are the most common sources of mold inside the home:
Flooding
Leaky roofs or damaged gutters
Heating or cooling system problems
Poor drainage next to foundation
Plumbing leaks from toilets, refrigerators, and dishwashers
Damp basement or crawl space
Leaking windows or doors
Steam from shower or cooking
Indoor exhaust from dryer
Detecting Mold in Your Home
If you can see or smell mold inside your home, it’s time to act. Any area that has sustained past or ongoing water damage should be thoroughly inspected—you may find hidden mold growth in water-damaged walls, floors, or ceilings. Walls and floors that are warping or discolored can also indicate moisture problems, as can condensation on windows or walls.
How to Prevent Mold in Your Home
Since mold is always present, there’s no way to eliminate it completely. You can control indoor mold growth, however, by controlling moisture.
Remove the source of moisture by fixing any leaks or other water problems.
Make sure your bathroom fans and dryers are properly vented to the outside. Always use the exhaust fan when cooking or showering.
Use a dehumidifier to reduce moisture levels in the air. Make sure your AC system is well maintained and is the correct size for your home. A faulty AC system can cool the air without removing the water vapor, creating high humidity.
Insulate your home well to prevent indoor condensation.
Have your heating, ventilation, and cooling systems professionally cleaned annually. Air-duct systems can easily become contaminated with mold.
Regularly clean moist areas such as the bathroom with products that treat mildew.
Dry clean your carpets (as opposed to wet cleaning them).
Avoid carpeting bathrooms and basements.
Clean any moldy surfaces as soon as you notice them.
How to Deal with Mold in Your Home
Mold can be a manageable problem. If you have a mold problem that is isolated to a small area—less than a square yard or so—you can try to resolve it yourself. However, if your mold problem is severe or if you have extensive water damage, it’s best to call a professional contractor who specializes in mold removal.
Porous items that are hard to clean, such as carpet and drapes, should be discarded. Moldy sheetrock and ceiling tiles can be removed and replaced. Hard, nonabsorbent surfaces such as glass, plastic and metal should be thoroughly cleaned with soap and water and allowed to dry completely. For solid items that are semi-porous, such as floors, cabinets, and wood furniture, scrub with an ammonia-free cleaner and hot water to remove the mold. Rinse with water and dry thoroughly. After cleaning, apply a mildewcide to kill mold and spores.
When cleaning mold, remember to wear gloves, a mask, and eye protection, and work in a well-ventilated area. Never mix cleaner containing bleach and ammonia; this can result in the release of a toxic gas. And be sure to throw away any sponges or rags that you use for cleaning. For more information on how maintaining your home can prevent damage, read our blog post on how to handle water damage.
This video is the latest in our Monday with Matthew series with Windermere Chief Economist Matthew Gardner. Each month, he analyzes the most up-to-date U.S. housing data to keep you well-informed about what’s going on in the real estate market.
Hello there, I’m Windermere Real Estate’s chief economist, Matthew Gardner, and welcome to the latest episode of Mondays with Matthew. This month we’re going to take a look at Blockchain technology and cryptocurrencies themselves and how both may impact home buyers and sellers in the future.
But before we dive into the potential impacts of cryptocurrency on the residential housing market, I must preface this by saying that the very word “crypto” is one that certainly divides people. Some see it as revolutionary, a tangible asset that will take over one day as the de-facto global currency, while others believe it to be unsustainable and ultimately valueless. And there are even some who firmly believe that it’s nothing more than a Ponzi scheme.
Now, everyone is certainly entitled to their opinion, and I will refrain from offering my own view on the currencies themselves, but, although still in its infancy, it continues to evolve and is garnering significant interest from individuals and large corporations alike.
Why are corporations interested, you ask? Well, a recent report from Crypto.com1 put the number of people around the globe who own some form of cryptocurrency at more than 295 million and they are forecasting this number to explode this year and hit the 1 billion mark! And the value of all these currencies today? As of March 14, the combined value of all cryptocurrencies was 1.74 trillion dollars2 with the largest, Bitcoin, valued at almost 740 billion dollars. So, it should not be a surprise to see many mainstream companies across multiple industry sectors start to introduce ways to accept crypto as payment for goods and services.
Companies moving into this space include AMC movie Theaters3 who recently announced their plan to accept coins by the end of this year. Fintech companies like Paypal and Square are also betting on crypto by allowing users to buy currency on their platforms. And, unsurprising to most, Tesla is also interested, but have yet to confirm whether they will accept coins as payment for their vehicles or not.
With cryptocurrencies now gaining traction in mainstream businesses, the housing sector has started to take an interest too with the emergence of companies like Propy, whose goal is to totally automate the home sales process by introducing Blockchain based technology to allow transactions to occur entirely online using smart contracts. Other companies are figuring out how to use blockchain technology to grow the “fractional-ownership” segment of the housing market.
But when it comes to simply buying a house—well that is an entirely different situation. Of course, a home buyer could easily cash out the Crypto they have and use those funds for a down payment, or even to buy a house outright. But we don’t see more of this today as they understand selling their currency is a taxable event and, more than likely, taxes owed will hit their balance sheets pretty hard. And knowing that this is a real issue in the market, it should come as no surprise that a company has come up with a plan to overcome what is seen as one of the biggest obstacles to using digital currency for home buying.
Blockchain Technology and Cryptocurrencies in Real Estate
And they are Milo, who claim to offer the world’s first “crypto-mortgage”. Essentially, they will allow borrowers to use Bitcoin—but only Bitcoin as of right now—as collateral for a 30-year mortgage.
How this works is pretty simple. All buyers have to do is to “pledge” their coins on a one-for-one basis. Simply put, someone looking for a $500,000 mortgage would have to put up $500,000 worth of Bitcoin. This way, they don’t actually have to sell their coins, so there are no tax implications. And instead of going through a FICO credit check and showing proof of income to evaluate a borrower’s creditworthiness, Milo evaluates them based on their crypto wealth as well as the value of the property they are hoping to buy.
And in exchange for locking up their crypto, borrowers get a 30-year mortgage for their home purchase can also make their mortgage payments via traditional currency or Bitcoin. But there are differences between this and a traditional mortgage. First off is the interest rate. It currently ranges anywhere from 5 to 8% depending on the loan-to-value ratio. This is higher than the rate they could get today.
And the interest rate is not fixed, but variable, and based on the prevailing price of Bitcoin. The rate can go up or down depending on the value of the Bitcoin they have pledged, and this mortgage rate will be adjusted every year. Interestingly, if the price of Bitcoin goes up, borrowers can actually take back some of their crypto once a year. If the price of Bitcoin goes down, they may be asked to provide more crypto as collateral.
And finally, when the buyer sells, on closing Milo is paid back in U.S. dollars, and then the seller gets the Bitcoins they used for collateral back, along with the profit made on the sale.
I think that this is certainly an interesting play in the ownership housing sector and, although still in its infancy, looks to meet the needs of crypto owners who don’t want to face the tax obligation that would occur if they were to sell their coins to buy a home. Now, I must make clear that Windermere is certainly not endorsing Milo. In fact, I personally have concerns about the program given how volatile cryptocurrencies are.
You see, it is possible that users may be caught out by the value of their Bitcoin dropping significantly and, if this occurs at or around their anniversary date, it could significantly raise the interest rate—and therefore the monthly payment—on that loan, and if the price drops too far, then they may have to go through what is, in essence, a margin call, where they will have to submit more funds to the lender to bring them back to a point where equity in the home combined with the value of the Bitcoin covers the loan itself.
And I would add that if for some reason the buyer has to sell the home within the first three years4 of purchase there are pre-payment penalties that will be incurred. All in all, it is an interesting model, but it is still in its infancy. As always, time will tell how well it gets adopted.
The bottom line for me is that the likelihood of Cryptocurrency revolutionizing the way we buy homes from a finance perspective is still several years away, but after that, who knows! Something that does have the capacity to be adopted into the mainstream far quicker is the blockchain technology itself. I personally see title insurance as a segment that could benefit significantly and may well adopt this tech sooner than others.
With title insurance companies responsible for verifying and ensuring that a buyer or lender (depending on the type of title insurance) gets either clean ownership or a lien position in the land in question, Blockchain could change many aspects of how these processes are carried out. Here are some of the benefits:
The Potential Benefits of Blockchain Technology in Real Estate
Security. More than 25 percent of title reports (alta.org) detail some form of defect to the title itself, but the ability of blockchain to immediately detect erroneous or potentially fraudulent information can significantly help to support the reliability of the records, therefore making the job of title insurance companies much more straightforward.
And then there’s smart contracts, which are actually a form of e-closing that is already beginning to be embraced by some in the industry. This technology makes the transfer of ownership almost seamless. Literally, it would take just a few clicks of a mouse. And this is also a massive benefit for the industry as the closing process would also change dramatically and become far more effortless and less time consuming than today’s standard means of closing on a home purchase.
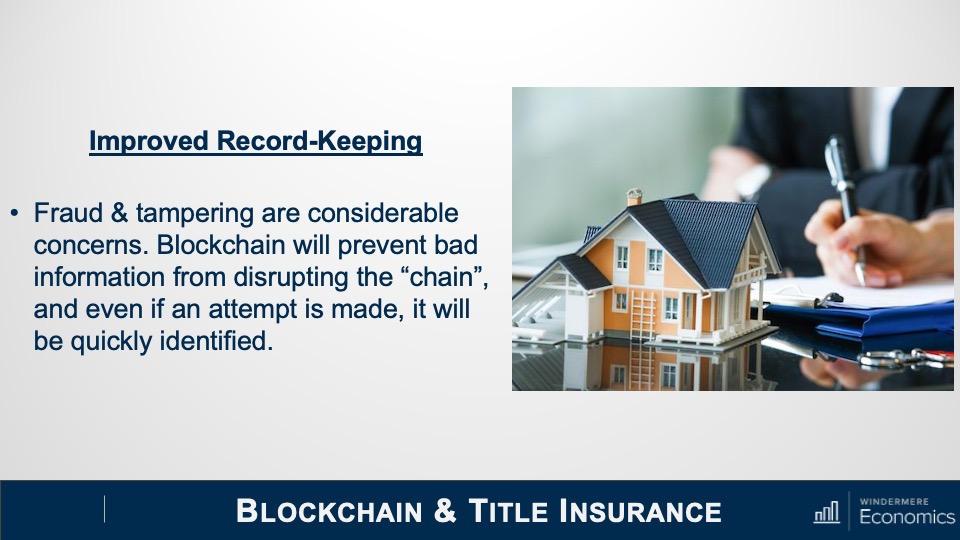
And finally, record-keeping. While fraud and tampering are huge concerns for title companies, blockchain could all but eliminate these instances within ownership records. And, as it would convert land records to a distributed ledger, it cannot be altered within the blockchain itself, therefore making it safe in perpetuity. Blockchain, by design, prevents bad information from disrupting the chain and any attempt to tamper with it can be easily detected and therefore avoided. This is a massive upgrade from the county ledger that title insurance companies find themselves working with today.
No one can deny that Blockchain and cryptocurrencies, while still relatively new, do not appear to be just a flash in the pan. As we have discussed today, a number of companies continue to make inroads into the real estate world. Will some fail? Of course. But others will succeed. So, while still in its infancy, we should all have some sort of understanding of its potential to be a disruptor in the housing space in the future.
It’s my own personal belief that the Blockchain tech itself will be the thing that gets adopted by the real estate world faster than the rise of crypto as a way to buy or finance a home but, whatever your thoughts on this topic are, I think that it is highly unlikely that we will see it simply fade away over time.
As always, if you have any questions or comments about this particular topic, please do reach out to me but, in the meantime, stay safe out there and I look forward to visiting with you all again next month. Bye now.
Known for its signature chic comfort, the farmhouse style is a popular method of interior design for homeowners looking to blend elements of modern and traditional design. With a rustic charm at its heart that recalls images of the countryside and wide-open landscapes, the farmhouse style steadily picked up steam in the 2010s and continues to grow in the 2020s. The following information is a guide to understanding the characteristics that make up the farmhouse style and how you can translate them into your home.
What is farmhouse style?
The farmhouse style predominantly uses a white/grey/beige color palette which provides a foundation for complementing elements and brighter colors. Against this clean backdrop, rustic materials can really shine. Exposed wood beams of timber or reclaimed wood, shiplap, and wrought iron are materials typically used help to round out the aesthetic, creating that rural-with-a-touch-of-modern feeling that the farmhouse style is known for. These combinations create a sense of openness and simplicity in the spaces where they’re used. In the kitchen, the farmhouse style feels clean and inviting; in the living room, it beckons members of the household and guests alike to sit back and relax; and in the dining room, it creates the perfect setting for enjoying a meal together.
When it comes to furniture, there are specific choices you can make that will help reinforce your personal farmhouse style. Functionality is a core principle of farmhouse design, exemplified by its use of reclaimed and found materials. When looking at furniture, tune your radar to pieces that are simple and functional rather than ornate and complex. Farmhouse’s warmth contrasts the colder feel of minimalism, so when thinking about texture, know that you’re not bound to selecting only the cleanest possible lines—feel free to experiment! With natural elements like stone and wood already providing a varied blend of textures, you can afford to be bold in your choice of throw pillows, blankets, carpeting, and furniture set pieces.
The farmhouse style will give you license to decorate with antiques and vintage materials. Items like armoires, wooden iceboxes, and vanities will find a fitting home among your complementary decorative items. With a prevalence of wood, choose grain patterns and wood tones that complement each other well without clashing. Clutter can get in the way of the coziness that the farmhouse style naturally evokes, so it’s important to keep your main living areas well maintained to truly let your home’s interior design flourish.
With the farmhouse style, it all comes back to comfort. If you’re looking to make the spaces in your home more comfortable, either fully adopting or borrowing from the farmhouse style may be just the ticket.
This video is the latest in our Monday with Matthew series with Windermere Chief Economist Matthew Gardner. Each month, he analyzes the most up-to-date U.S. housing data to keep you well-informed about what’s going on in the real estate market.
The Impact of Rising Mortgage Rates
Hello there. I’m Windermere Real Estate’s Chief Economist Matthew Gardner. Welcome to the latest episode of Monday with Matthew.
Over the past several weeks I’ve gotten a lot of messages from you wanting me to discuss the spike in mortgage rates that followed comments by the Federal Reserve, but also asking me if there will be any impacts to the housing market following Russia’s invasion of the Ukraine. This is clearly a hot topic right now, so today we are going to take a look at how these events have impacted mortgage rates, but also look at how this may have changed my mortgage rate outlook for 2022. So, let’s get to it.
Weekly Mortgage Rates
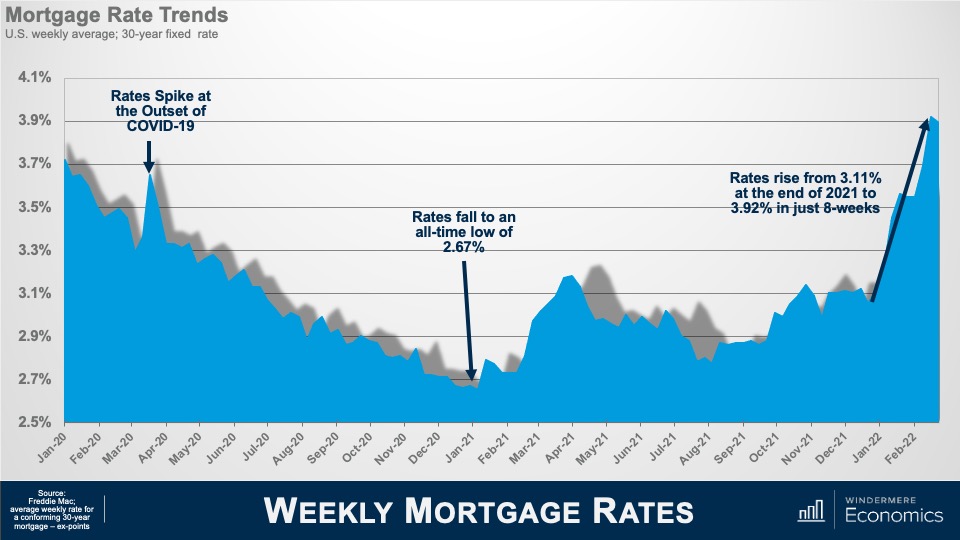
Here is a chart that shows how rates have moved over the past two years or so using Freddie Mac’s average weekly rate for a conforming 30-year mortgage. You’ll see that rates were falling in early 2020, but when COVID-19 was announced as a pandemic they spiked, but almost immediately the Fed announced their support for the economy by implementing a broad array of actions to keep credit flowing and limit the economic damage that the pandemic would likely create. And part of that support included large purchases of U.S. government and mortgage-backed securities. With the Fed as a major buyer of mortgage securities, rates dropped ending 2020 at a level never seen in the more than 50 years that the 30-year mortgage has been with us.
In early 2021, rates started to rise again as the country became more confident that the pandemic was coming under control, but all that changed with the rise the Delta variant of COVID-19 which pushed rates lower through mid-summer. As we again started to believe that COVID was under control and a booster shot became available, you’ll see rates resumed their upward trend in August.
What has everyone worried today is this spike that really took off at the end of last year. A jump of almost a full percentage point in just eight short weeks understandably has a lot of agents, buyers, and sellers, concerned about what impacts this might have on what has been a remarkably buoyant housing market. Now, rates rising so quickly was unusual, but not unprecedented. If you really wanted to be scared, I’d regale you with stories from 1980 when mortgage rates jumped by over 3.5% in less than eight weeks.
Anyway, before we really dig into this topic, some of you may be thinking to yourselves that my numbers have to be wrong because they differ from the rates you have been looking at. This is due to the fact that the Freddie Mac survey methodology is different from other rate surveys but, even though their rates may not match the ones you’ve been seeing from other data providers, the trend is still consistent.
So, let’s chat for a bit about what caused the spike in rates. You know, it’s always good to have a villain in any story and the primary but certainly not sole culprit responsible for the jump in rates is—you guessed it—the Federal Reserve.
As I mentioned earlier, the Fed was the biggest buyer of pools of home loans (otherwise known as mortgage-backed securities) as we moved through the pandemic, but last December they announced an end to what had been an era of easy money by winding down these purchases in order to lay the groundwork for shrinking their 2.7 trillion—yes I said “trillion”—dollar stockpile of MBS paper they had built up. This decision to move from “quantitative easing” to “quantitative tightening” so rapidly had an almost immediate impact on mortgage rates simply because the market was going to lose its biggest buyer of mortgage bonds.
Immediately on the heels of their announcement, bond sellers raised the interest rate on their bond offerings to try and find buyers other than the Fed, so lenders raised the rates on mortgages housed within these bond offerings. Finally, mortgage brokers moved quickly to raise the rates that they were quoting to the public. The result of all this was that rates leapt. Although we know that the primary party responsible for rates rising was the Fed, there were other players too, and here I am talking about inflation—and as you are no doubt aware—it too started to spike at the beginning of this year and now stands at a level not seen since 1982. And if you’re wondering why inflation is important. Well, high inflation is a disincentive to bond buyers because if the rate of return, or interest on mortgage bonds, is lower than inflation, investors lose interest pretty quickly.
So, we can blame the Fed, we can blame inflation, but what about Russia? Well, their invasion of the Ukraine on February 24 has certainly influenced mortgage rates, but maybe not in the way you might expect. In general, when there’s any sort of global or national geopolitical event, investors tend to gravitate to safety, and this invariably means a shift out of equities and into bonds.
So you would be correct is thinking that at face value Russia was actually responsible for the tiny drop in rates we saw following the invasion, and also the more significant drop we saw last week when the market saw the biggest two-day drop in rates in over a decade. But before you start to think that rates are headed back to where they were a year ago, I’ve got some bad news for you. That is almost guaranteed not to happen.
Given what we know today, the terrible conflict in Eastern Europe is highly unlikely to push rates back down to where they were at the start of this year, but they will—at least for now—act as a headwind to rates continuing to head higher at the pace we have seen over recent weeks. That will continue until the conflict is hopefully peaceably concluded. And although the Ukraine situation is unlikely to have any significant impact up or down on mortgage rates, there are some indirect impacts which could negatively hit the housing market. Now I’m talking about oil.
Russia is the third largest energy producer in the world and an already tight global oil supply could get even tighter following newly announced financial sanctions on Russia. A barrel of oil has jumped by almost $20 to $109 a barrel since the start of the occupation and, if the occupation is sustained, and Russia is faced with even greater sanctions, I wouldn’t be surprised to see the price of gas rise by between 20 and 40 cents a gallon. And it’s this, in concert with already high inflation, which will directly hit consumers wallets and this itself could certainly impact mortgage borrowing. So we can blame the Fed, we can blame inflation and we can blame Russia for the jump in rates, but are the rates you are seeing today really something to lose sleep over? I actually don’t think so. At least not yet.
Even with mortgage rates where they are today, I look at them and think to myself that they are still exceptionally low by historic standards and that there really is no need for panic. But let me explain my thinking to you. To do this, we will take a look at the impact of rising mortgage rates, not as it relates to buyers’ ability to finance a home purchase, but on how it impacts their monthly payments.
Hypothetical Home Purchase
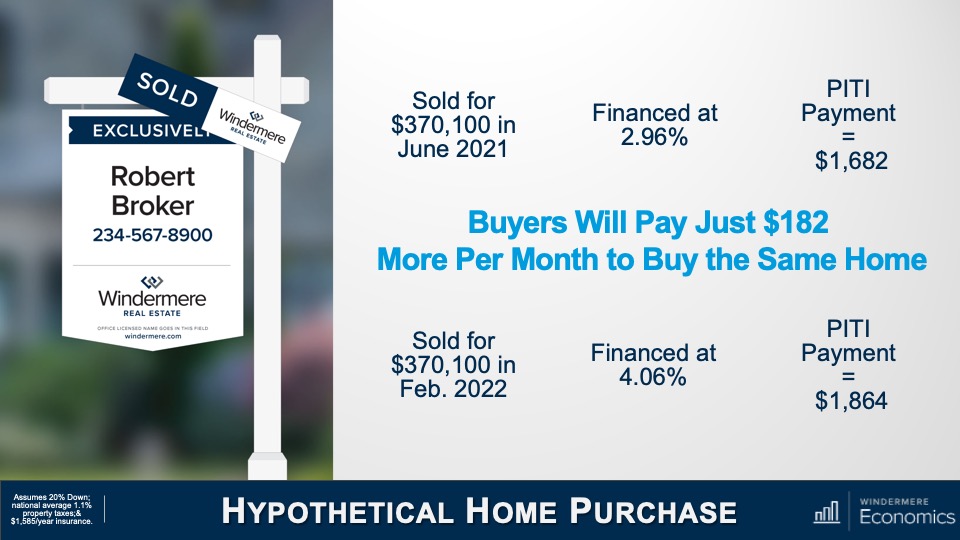
For this example, we’ll use the peak sale price for a single-family home in America, which was just over $370,000 back in June of last year. And to finance this purchase, a buyer was lucky enough to lock in the lowest mortgage rate for that month at 2.96%. Assuming that they put 20% down, and are paying the U.S. average homeowners insurance premium and average property taxes a buyer closing on that home in June of last year would have a monthly payment of $1,682.
Now, what if a buyer had bought the exact same house but in February of this year? Well, the average rate for the third week of February was 4.06%—a big jump from last June—and higher mortgage rates would have increased their payment to $1,864. What does this all mean? Well, a jump of over a full percentage point means that the monthly payment is more, but only a relatively modest $182. So, even though rates have risen by almost a full percentage point, the increase in payments was, I think you’ll agree, relatively nominal.
But what if rates had risen to 5%? Well, that would be a very different picture with payments increasing by a far more significant $348. Of course, this is a very simplistic way of looking at it as I have not included any other debt payments that a buyer may have, but I hope that it does demonstrate that, even though mortgage rates are certainly significantly higher than they were last summer, because we started from such a low basis, monthly payments have seen a relatively modest increase. The bottom line is that rates were never going to hold at the record lows we have seen, and we need to just accept the fact that they will continue trending higher as we move through the year but are yet at a level that suggests impending doom for the housing arena. So, where do I think that rates will be by the end of this year? Well, here is my very latest forecast for the rest of this year.
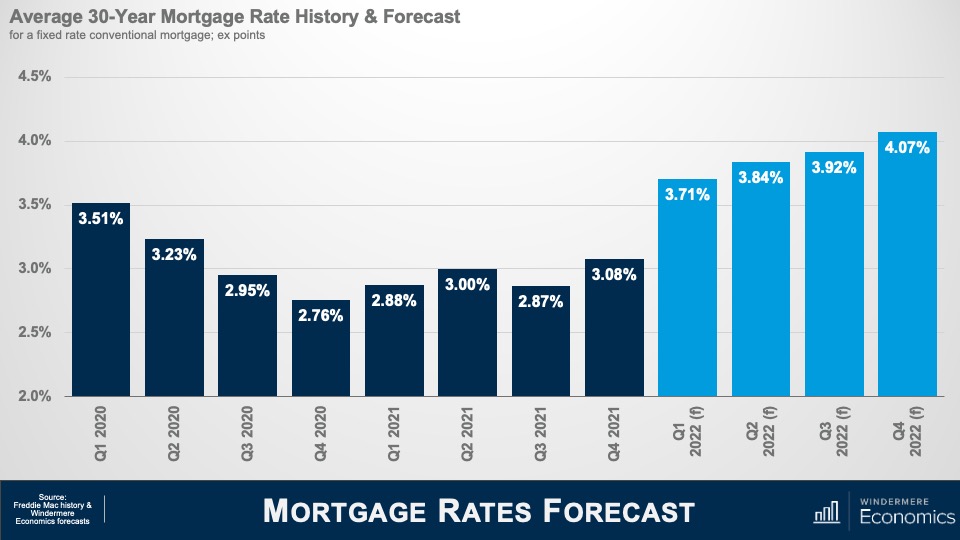
Mortgage Rates Forecast
Given all we know in respect to the Fed and the current situation in Ukraine, my model suggests a significant jump in the first quarter, but then the pace of increase slows significantly and we will end this year at a rate that is almost half a percentage point above the forecast I offered at the start of the year.
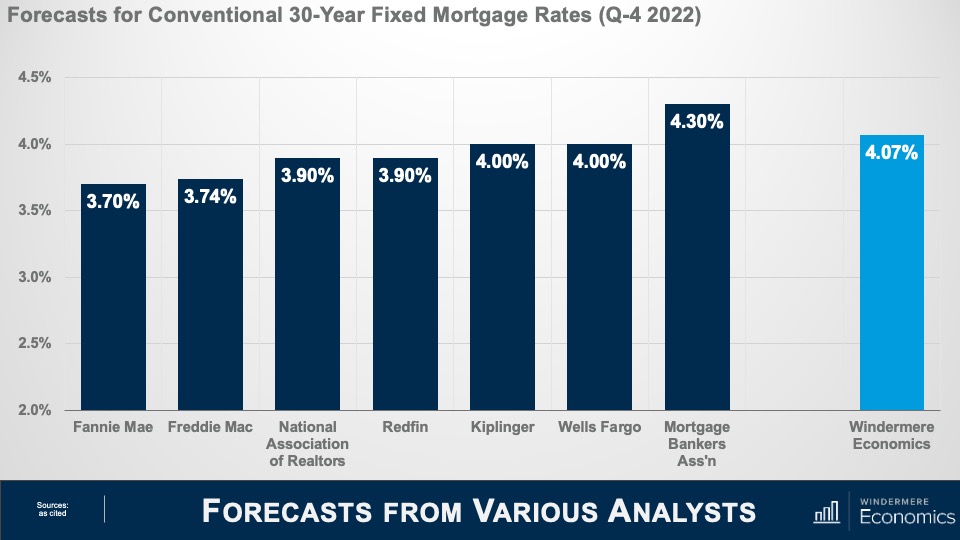
Forecasts From Various Analysts
Of course, this is the opinion of just one economist, so I thought it would be useful for you to see what others are thinking. And amazingly enough, most of us—at least for now—are still in a pretty tight range regarding our expectations for the average rate in the 4th quarter of 2022 with Fannie Mae at the low end of the spectrum and the Mortgage Bankers Association at the high end.
I honestly believe that, all things being equal, the impact of higher mortgage rates is unlikely to significantly impact the U.S. market this year and, even with rates rising, the market will remain tight in terms of supply and will continue to favor home sellers. That said, once we break above 4.5%, I would expect to see the increased cost of financing having a greater impact on not just on demand but on price growth, too.
And if you are wondering why I am so sure about this, it’s simply because we saw the exact same situation in 2018 when rates rose to 4.9% and we saw a palpable pull back in sales; which dropped from an annual rate of 5.4 million to 5 million units and the pace of price growth dropped from 5.9% to 3.3%. Now, I don’t see rates getting close to 5% for quite some time and therefore still expect demand to remain robust—off the all-time highs we have seen—but still solid given demographically-driven demand as well as increasing demand from buyers trying to find a new home before rates much further.
Of course, the impact of rates rising will not be felt equally across all markets. Many areas, and especially in coastal States, have seen home values skyrocket to levels that are well above the national average. Although incomes are generally higher in these markets, buyers in more expensive areas will feel more pain from higher financing costs.
And there you have it. I hope that today’s chat has not only given you some additional tools to use in your day-to-day business but has also given you enough information to hopefully ease some of the worry that many of you are feeling right now. As always, if you have any questions or comments about this particular topic, please do reach out to me but, in the meantime, stay safe out there and I look forward to visiting with you all again next month.
A real estate agent is an invaluable asset. They will work with you to get your home sold for the best price and in a timely manner. Before you find the right agent to sell your home, it’s important to understand how you can work together toward a successful sale. The following information will help you prepare for your discussions with your agent.
Working with a Real Estate Agent to Sell Your Home
Before you choose a real estate agent, determine your wants and needs and create realistic goals. Even though your agent is the one with the expertise, the tools, and the know-how, no one knows your home like you do, and the clearer you can communicate your aspirations, questions, and concerns to your agent, the more you’ll inform their decision-making process. Even something seemingly small, like sharing your preferred method of communication, can help them understand how you can best work together.
A great first step is to determine your pricing goals for your home. Your agent will conduct a comparative market analysis (CMA) to determine the value of your home, which will allow them to price it accurately. If there is a large discrepancy between what you were hoping your home would sell for and its actual value, your agent will be able to explain the factors that influence home prices and clarify whether it’s the right time to sell.
Prepare a list of all remodels and renovations you’ve completed on the home so your agent can understand how much you’ve invested in the property and the scope of work it took to get it in its current condition.
You should also set expectations for open houses and showings. Your agent will go to great lengths to effectively market your home, but by understanding your schedule ahead of time, you’ll be able to better communicate your availability when it comes time to engage with buyers. Talk to your agent about how to prepare your home for open houses and tours, the process for screening potential buyers, and which safety precautions to take before conducting walkthroughs.
Once you’ve found a buyer for your home, your agent will work with you through the purchase and sale agreement. This contract will outline the terms of the agreement between you and the buyer, spelling out the finer points of the transaction, such as the receipt of earnest money, any addendums and/or contingencies, inspection terms, etc. Your agent will also negotiate with the buyer’s agent to determine a closing date and will communicate which settlement fees you may incur, if any.
Working with an agent is the best way to ensure that your home is accurately priced. Incorrect pricing can be one of the costliest mistakes in selling a home. Beyond their talent for number crunching, your agent will be there to hear your ideas, answer your questions, and allay your fears. Selling a home can be an emotional roller coaster but having an agent by your side through it all can make it a much smoother ride.
Not only are real estate agents licensed professionals who possess a wealth of knowledge about the process of selling a home and how to navigate your local market conditions, but they are also well-connected. Selling a home requires looping in multiple professionals from a variety of disciplines. Whether it’s a lawyer, home inspector, appraiser, remodeling contractor, etc., your agent can help you find the professionals you need throughout your home selling journey.
Designing your home can feel like trying to put together a puzzle. While neutrals can help create consistency and set a calming tone in your home, color is often the missing puzzle piece that ties everything together and gives your home the life you’re looking for. Certain color combinations can create a sense of timelessness while others can help make your spaces feel modern.
Colorful Modern Design Trends for Your Home
In recent years, sustainability, multifunctionality, and the integration of natural elements into the home have cemented themselves as modern design trends that possess serious staying power. These trends go hand-in-hand with many aspects of modern life and are often the basis of homeowners’ decorations decisions. Here’s how you can you use color to create a modern look in your home.
Image Source: Getty Images – Image Source: Dreamer Company
Say “So Long!” to Neutrals
A combination of factors—people spending more time at home, remote work becoming more prevalent, the lasting effects on home life throughout the COVID-19 pandemic—have created a shift in how neutrals are viewed. Moving forward, expect to see a different take on the old “less is more” saying when it comes to home décor. Colors are officially back. Instead of minimalist, white-washed backdrops, designers suggest experimenting with more colorful landscapes to create vibrant, lively spaces. Now is the time to consider painting your kitchen cabinets something vibrant, add those multi-colored throw pillows that may have previously seemed too bold, or try out that wild idea you had for a gallery wall.
Image Source: Getty Images – Image Source: Onzeg
Healing Colors
Recent times have raised homeowners’ collective awareness about the meaning of the spaces they live in and how they impact their overall wellbeing. This perspective shift has elevated the importance of earthy tones. Deep greens, organic browns, rust-tinged oranges, calming blues, and illuminating yellows are all colors that bring natural elements to mind—i.e., plants, running water, the sun. Let your imagination run wild with ways that you can incorporate these colors into your home to give it a modern effervescence.
Tile and furniture are some other larger surface areas that can greatly benefit from a splash of color. Different tile designs can evoke different aspects of modern design and help to liven up backsplash-heavy spaces like your kitchen or your bathroom where white subway tile may leave something to be desired. Give yourself carte blanche when searching for colorful furniture. Explore bold patterns and different color combinations that complement other items in the spaces they’ll inhabit.

 Facebook
 X
X
 Pinterest
 Copy Link