Facebook
 X
X
 Pinterest
 Copy Link
SOURCE: Windermere
There are plenty of good reasons to make your house a little greener, including saving money on energy expenses and ensuring a more livable planet for future generations. No matter what your motivation, making eco-friendly changes doesn’t have to be a daunting proposition.
The following relatively simple tips will help to not only reduce your carbon footprint to realize savings but also bring the peace of mind that comes from making smart choices for the environment.
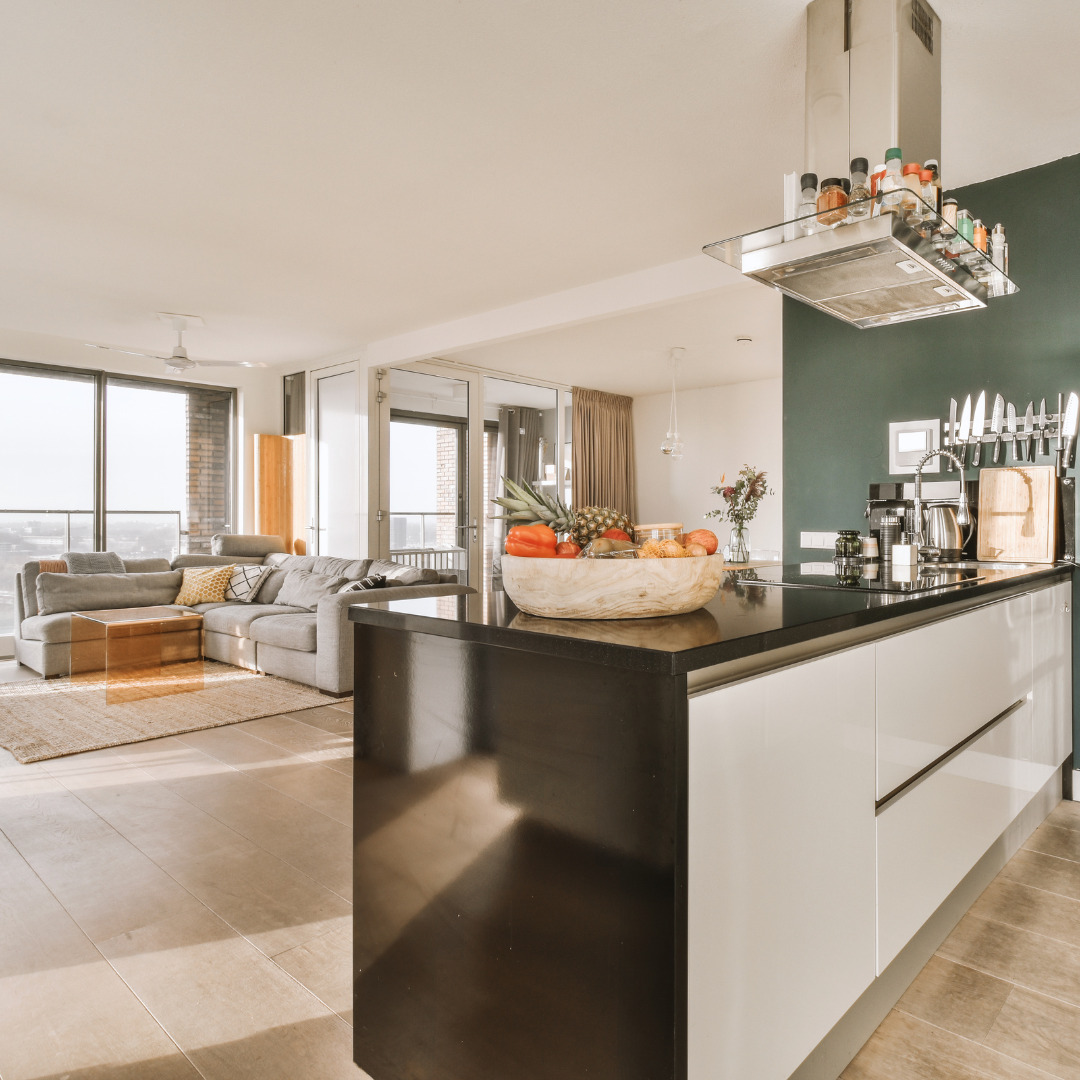
Reduce Water Usage
For many homeowners, the highest utility expense is the water bill. We all know that taking shorter showers and only running the dishwasher when it’s full can help reduce water usage, but there are other ways to find savings.
If you are an ardent gardener, collect water in a rain barrel during the wetter months to use on plants and yards when outside temperatures go up. Installing a low-flow or dual-flush toilet (or retrofitting your existing toilets) can also reduce the amount of water that goes down the drain.
Invest in Energy Star® Appliances
If your appliances—including your washer and dryer, refrigerator, water heater, or television—are more than ten years old, buying new ones could be all it takes to save money.
For an even bigger bang for your buck, invest in Energy Star appliances. To be certified as Energy Star, appliances must meet strict standards for energy efficiency set by the Environmental Protection Agency (EPA). The upfront cost of these products can be a little heftier than other appliances, but rebates and federal tax credits can help offset that initial expense.
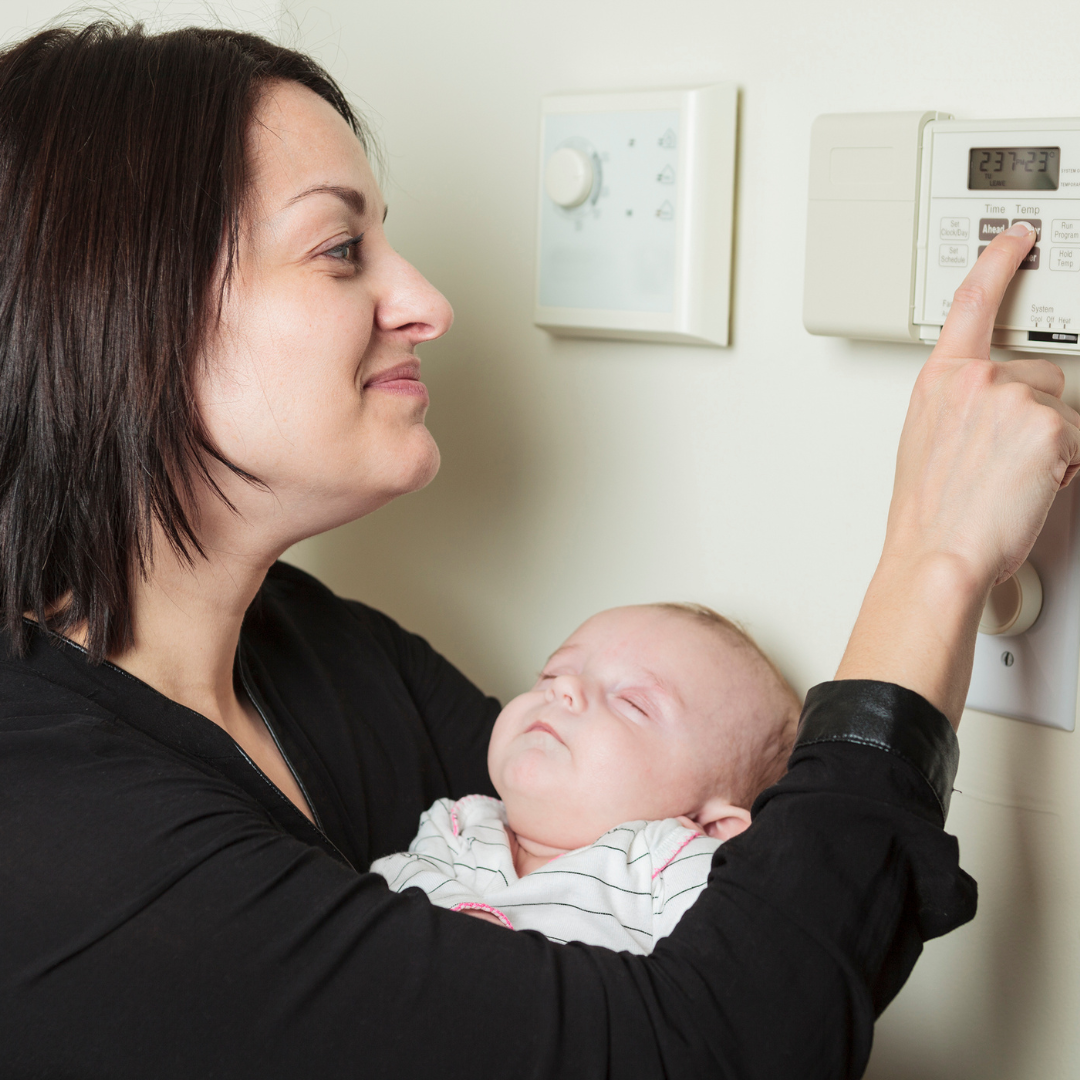
Get a Smart Thermostat
Many thermostats have a scheduling feature to help manage your heating and cooling. This can be helpful if you have a consistent daily routine of when you will be home and out of the house to save energy during the hours when you’re away or asleep.
You can now find thermostats that meet the EPA’s criteria for energy efficiency. Energy Star smart thermostats are Wi-Fi-enabled and give you better control over the heating and cooling of your home. Many of these options have apps on your smartphone that give you the power to adjust from your fingertips. And over time, they can learn your preferences, including times you are away from home and when you sleep, to improve efficiency. They can also provide insight into your energy usage so you can make adjustments yourself for optimal performance.
Plant a Tree or Two
Trees not only suck carbon dioxide out of the atmosphere while producing the oxygen we need for fresh air, but they also provide shade for homes in the summer months, which can cut down on the time you need to run an air-conditioning unit or the AC function of your HVAC system. Plant trees on the south and west side of your home for the best results. Trees that shed their leaves in the fall can provide mulch for your yard or garden, thus reducing the amount you’ll need to water them in the summer and fall.
SOURCE: Windermere