Facebook
 X
X
 Pinterest
 Copy Link
SOURCE: Windermere
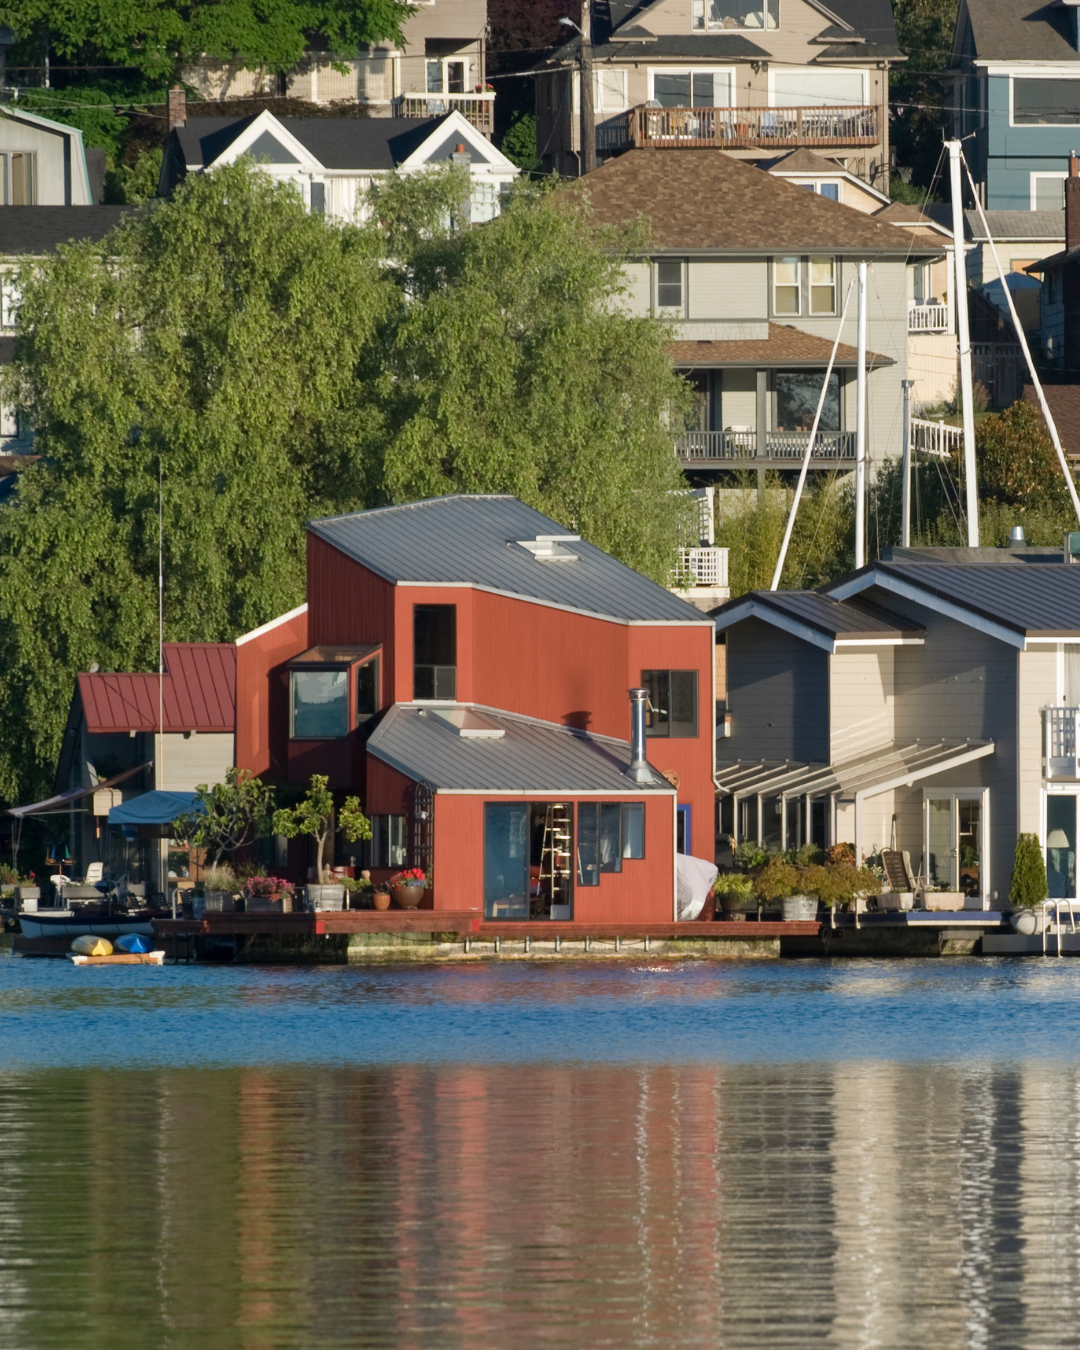
Short for “prefabricated,” prefab architecture refers to a type of construction where building components are manufactured off-site and then transported and assembled at the construction site. In recent years, prefab architecture has transformed how homes are built and designed, gaining popularity due to its efficiency, cost-effectiveness, and sustainability. In this post, we’ll explore the various types of prefab architecture, examine its pros and cons, and help you determine whether it fits your lifestyle, wants, and needs.
What is Prefab Architecture?
Prefab architecture is any structure built using components made off-site and then brought to a lot for assembly. Due to increasing appeal, prefab homes now come in various sizes, styles, and distinct forms to suit a range of needs and preferences. They can range from small backyard bungalows or guest houses to larger, multi-story, single-family homes, and the best part, they can be highly customizable. Some of the most common types of prefab construction include kit homes, modular homes, and panelized homes, each with its own set of benefits.
Kit Homes
A kit home is a prefabricated home that comes in pre-cut materials and is delivered to a property with instructions for building. They are smaller and more straightforward structures, often chosen by those who prefer a DIY approach. These homes are also typically more affordable and customizable.
Modular Homes
Similarly, modular homes are prefabricated homes made up of sections, known as modules, also made in a factory or off-site and then transported to the construction site. Unlike kit homes, modular homes must be assembled on a permanent foundation. Due to the pre-built sections, modular homes tend to be quicker to assemble and require the least amount of on-site work.
Panelized Homes
Panelized homes are another popular method of prefab architecture. Instead of building entire sections or modules, this technique involves constructing individual panels—including walls, floors, and roofs—in a factory. Compared to modular homes, panelized homes offer much more flexibility and customization in design and layout during the building process.
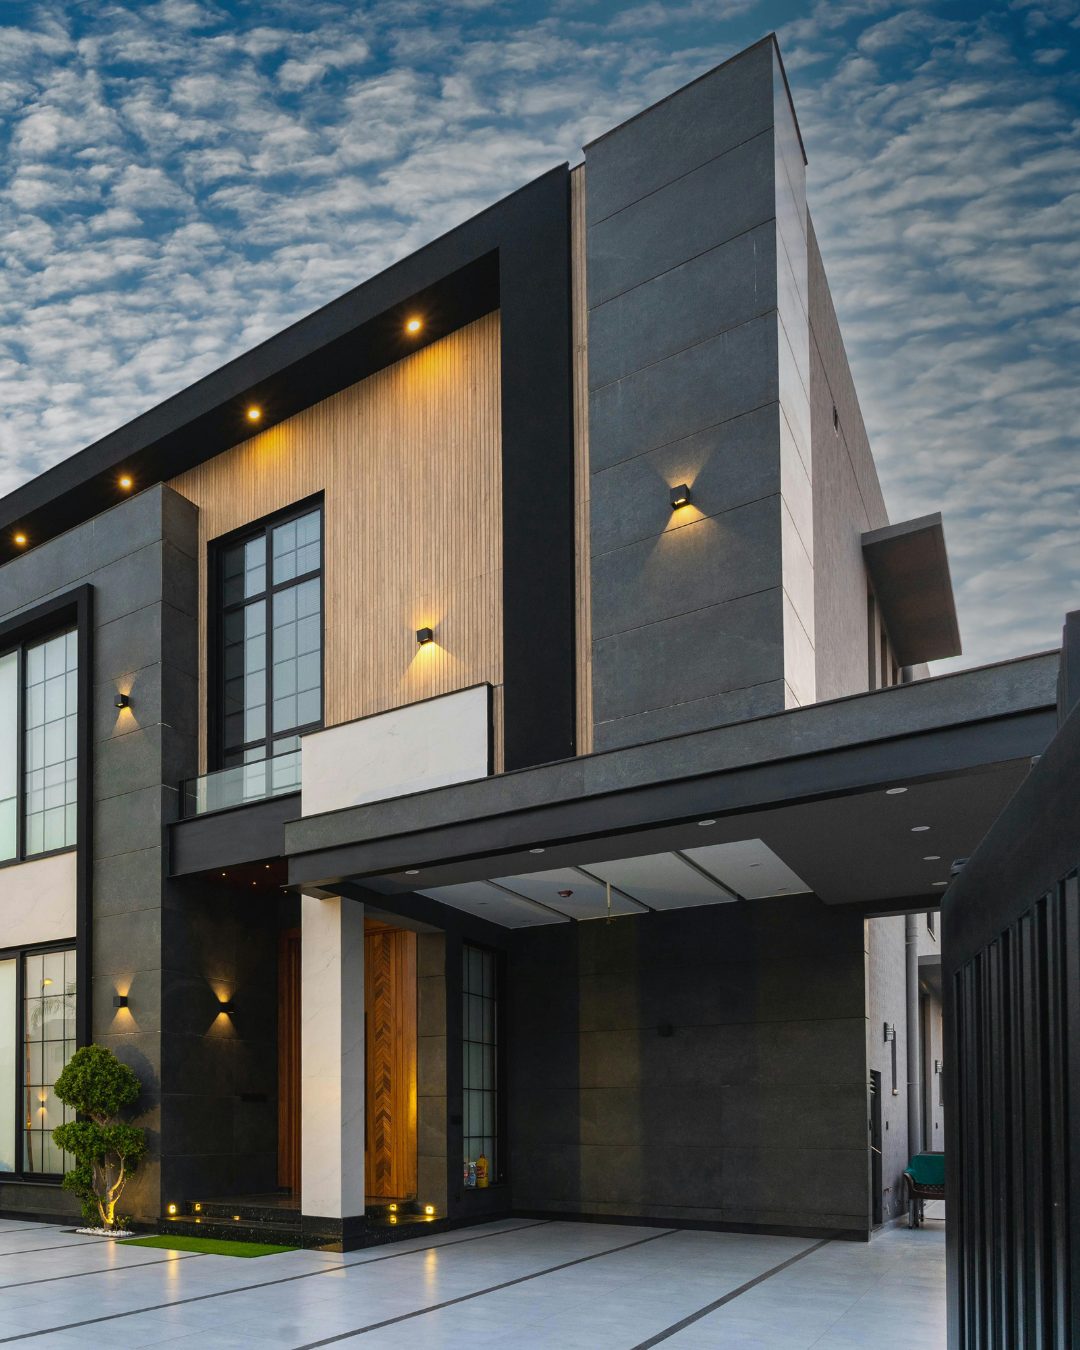
Pros and Cons of Prefab Architecture
Prefab architecture offers many benefits that make it an appealing choice for many people. The primary advantages include reduced costs, faster construction times, and a smaller environmental footprint with excellent energy efficiency. This is due to the controlled factory environment where the building components are made, minimizing waste, optimizing materials, and reducing on-site interferences like weather delays or unexpected construction challenges. Additionally, prefab homes often come with high-quality construction standards and can be highly customizable to fit different styles and preferences.
However, there are still some downsides and drawbacks to consider when thinking about investing in a prefab home. Land costs, transportation fees, utilities setup, and the need for permits can make for higher upfront expenses than expected. Additionally, some locations have stricter zoning laws and building regulations that may prevent or limit where prefab homes can be placed.
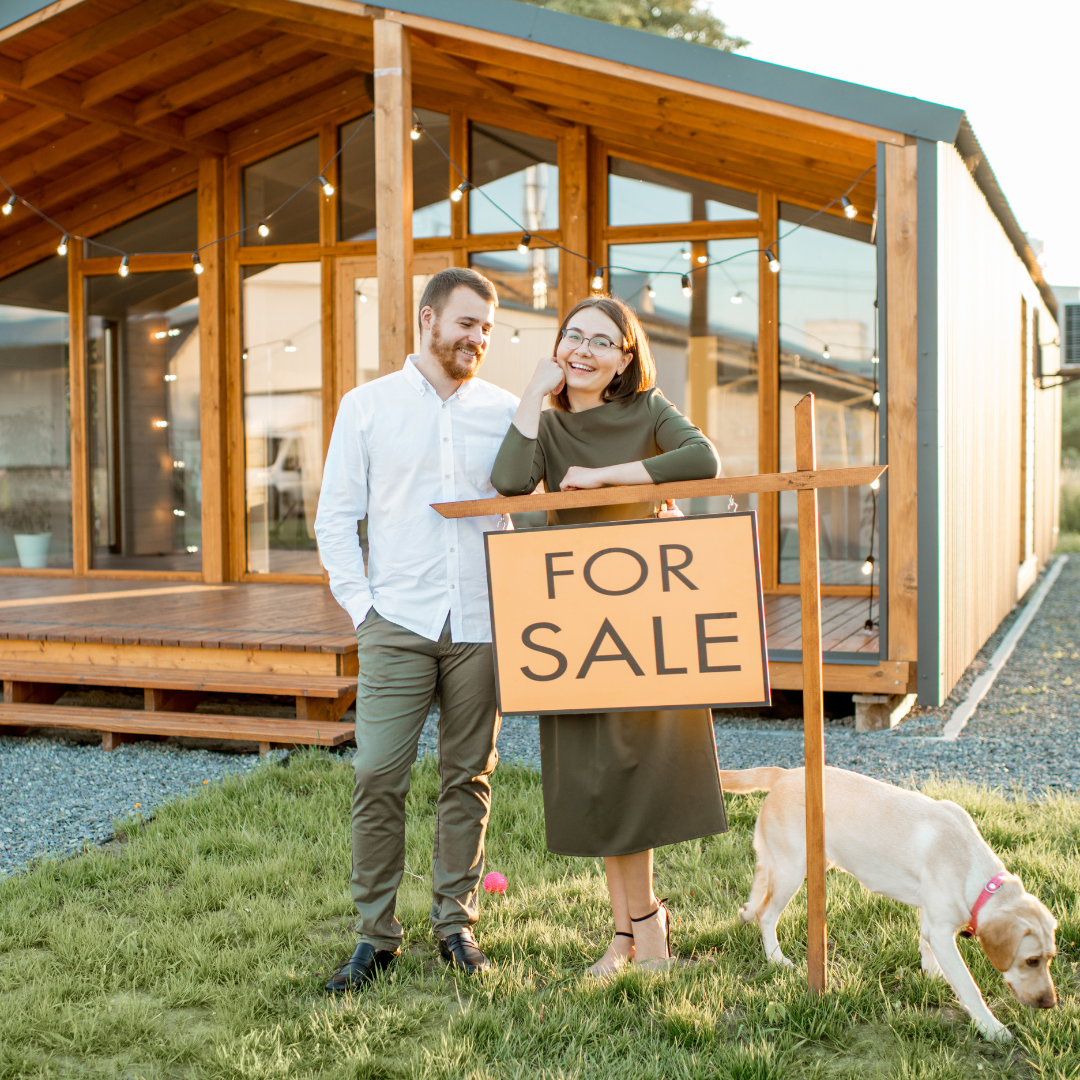
Is Prefab Right for You?
Prefab architecture combines affordability and sustainability, offering an innovative solution for those seeking a modern and efficient living space. So, whether you’re looking to downsize or embrace a more eco-friendly lifestyle, a prefab home could be the ideal choice for your next home.
SOURCE: Windermere