
 Facebook
 X
X
 Pinterest
 Copy Link


The following analysis of select counties of the Western Washington real estate market is provided by Windermere Real Estate Chief Economist Matthew Gardner. We hope that this information may assist you with making better-informed real estate decisions. For further information about the housing market in your area, please don’t hesitate to contact your Windermere Real Estate agent.
Regional Economic Overview
The post-COVID job recovery continues. Though data showed the number of jobs dropped in January, February saw gains that almost offset the jobs lost the prior month. As of February (March data is not yet available), the region had recovered all but 47,000 of the more than 300,000 jobs lost due to the pandemic. Of note is that employment levels in Grays Harbor, Thurston, San Juan, and Clallam counties are now above their pre-pandemic levels. In February, the regional unemployment rate rose to 4.1% from 3.7% in December. Although this may be disconcerting, an improving economy has led more unemployed persons to start looking for a job, which has pushed the jobless rate higher. I expect the regional economy to continue expanding as we move into the spring and summer, with a full job recovery not far away.
Western Washington Home Sales
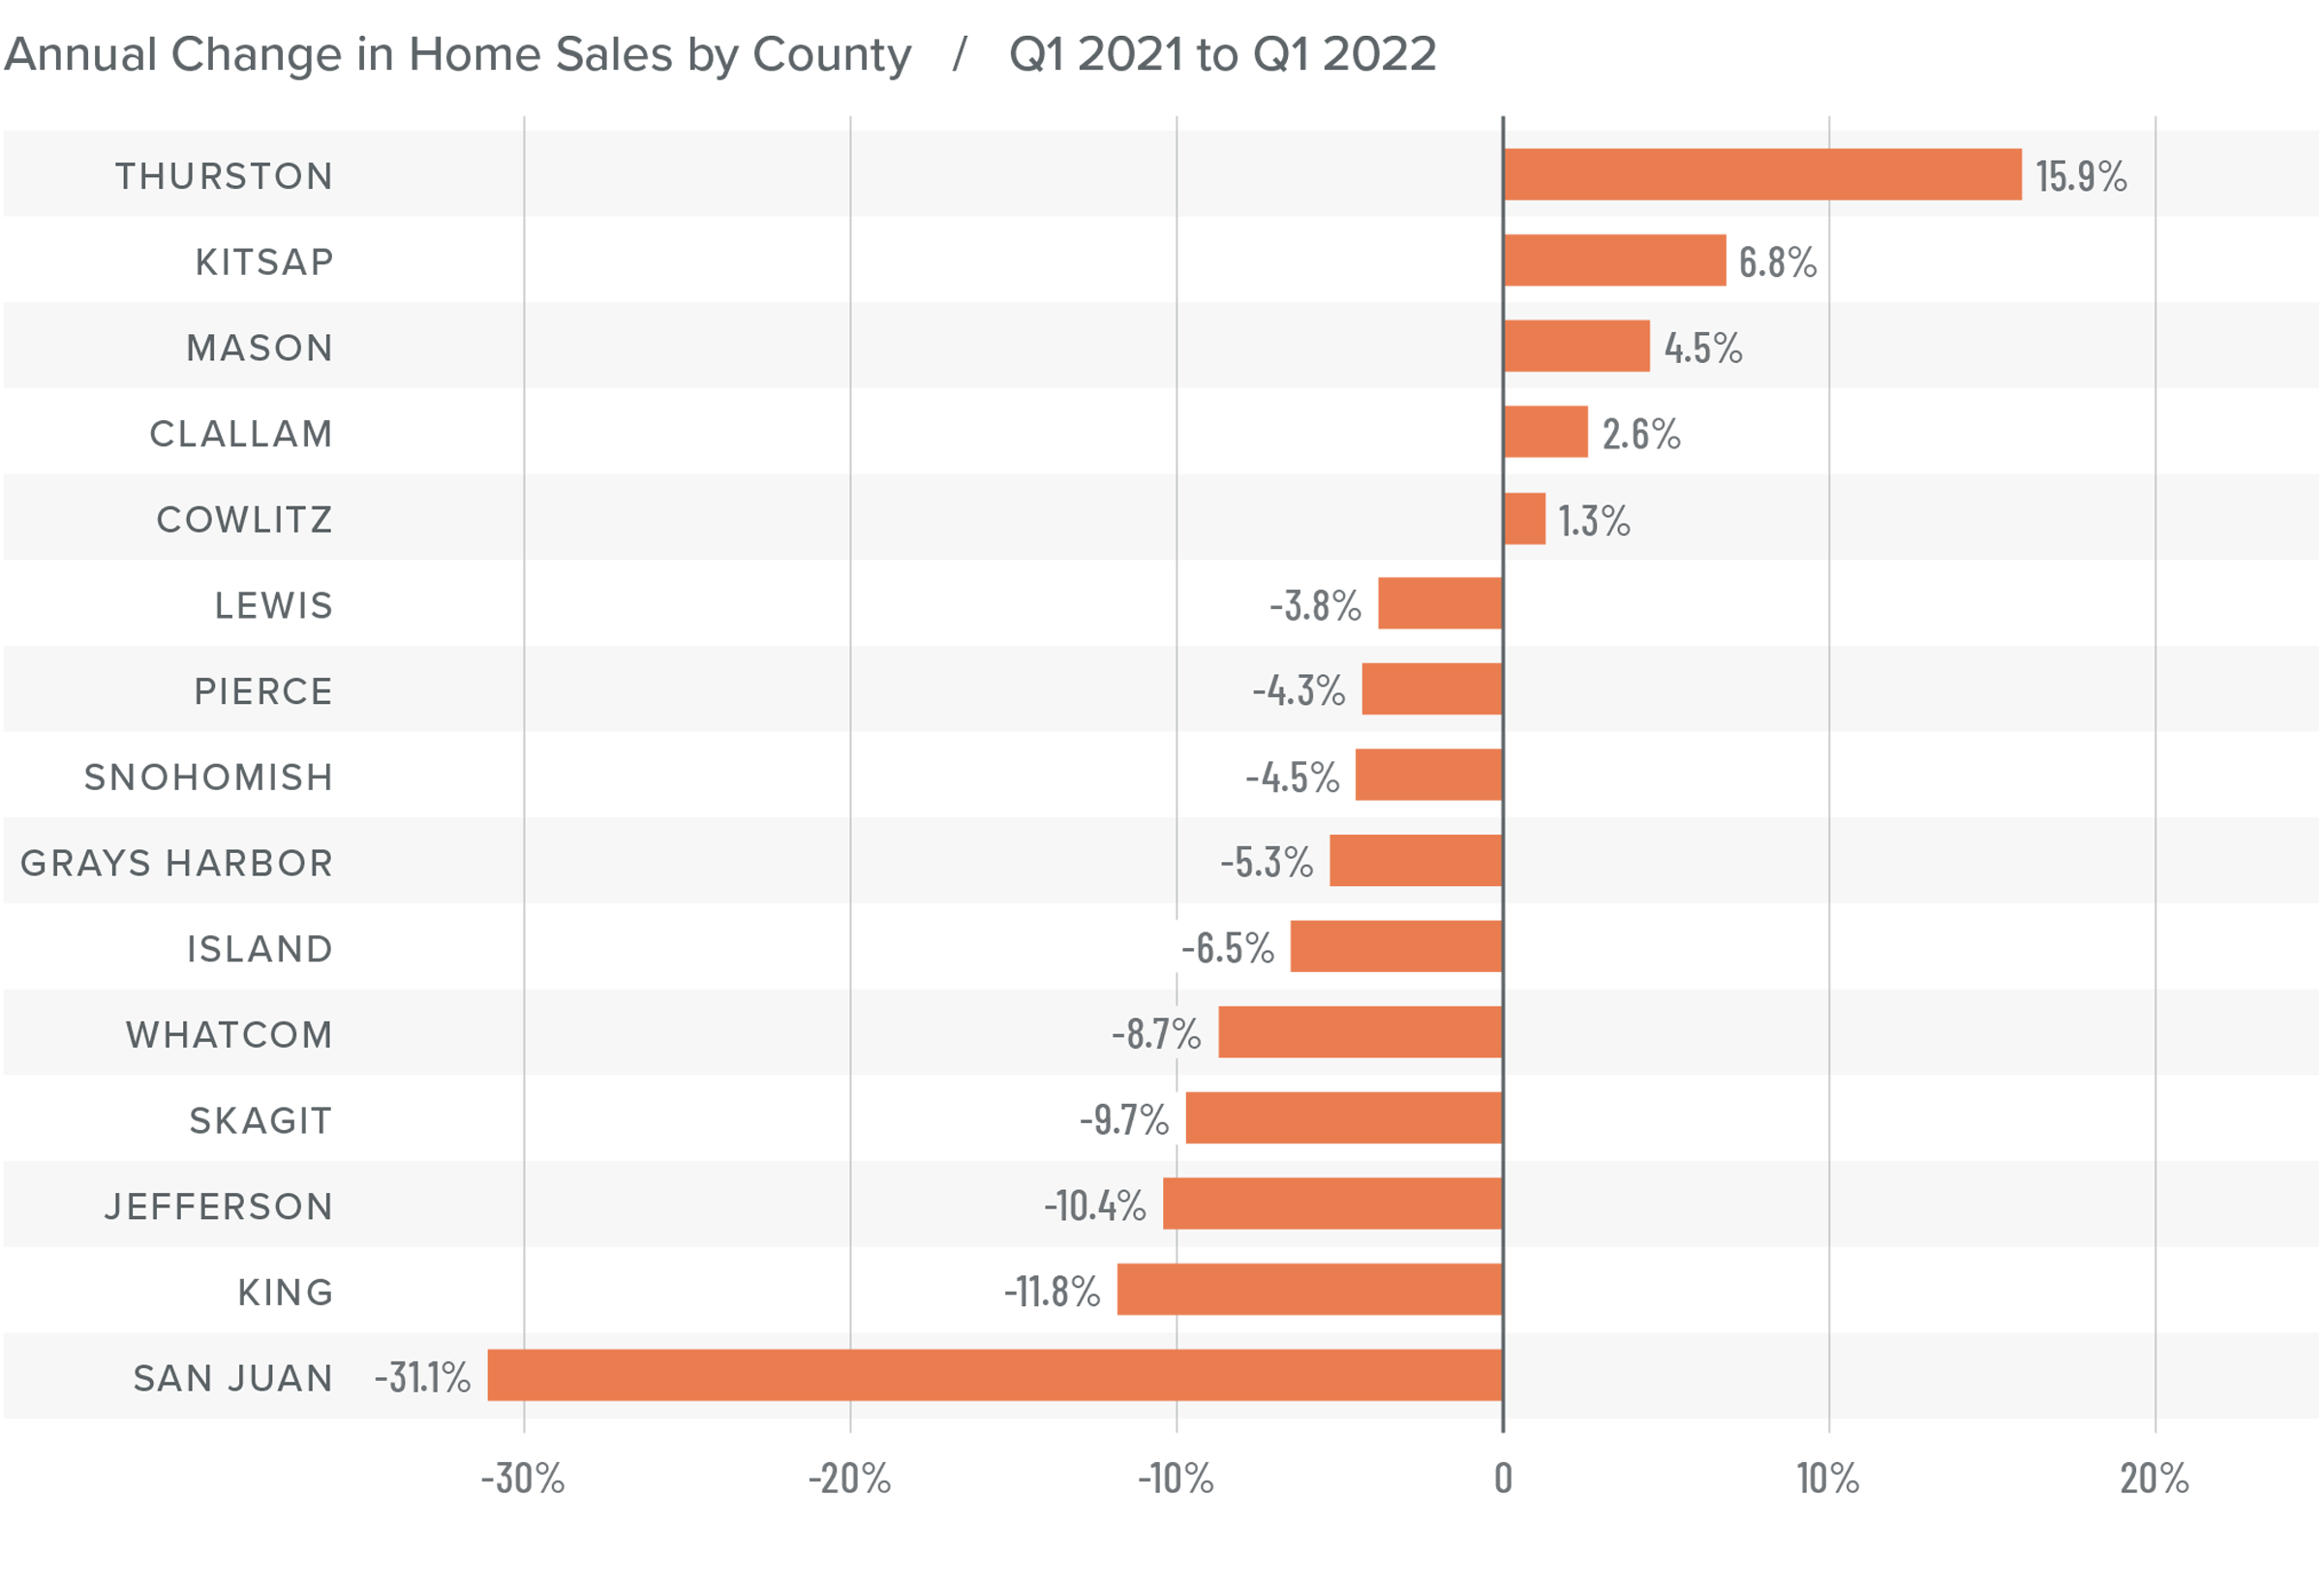
❱ In the first quarter of 2022, 15,134 homes sold, representing a drop of 5.8% from the same period a year ago, and down 31.7% from the fourth quarter.
❱ Yet again, supply-side constraints limited sales. Every county except Snohomish showed lower inventory levels than a year ago.
❱ Sales grew in five counties across the region but were lower across the balance of the counties contained in this report. Compared to the fourth quarter, sales were lower across all market areas.
❱ The ratio of pending sales (demand) to active listings (supply) showed pending sales outpacing listings by a factor of 6.7. Clearly, the significant jump in mortgage rates in the first quarter has not yet impacted demand. Rather it appears to have stimulated buyers partly due to FOMO (Fear of Missing Out)!
Western Washington Home Prices
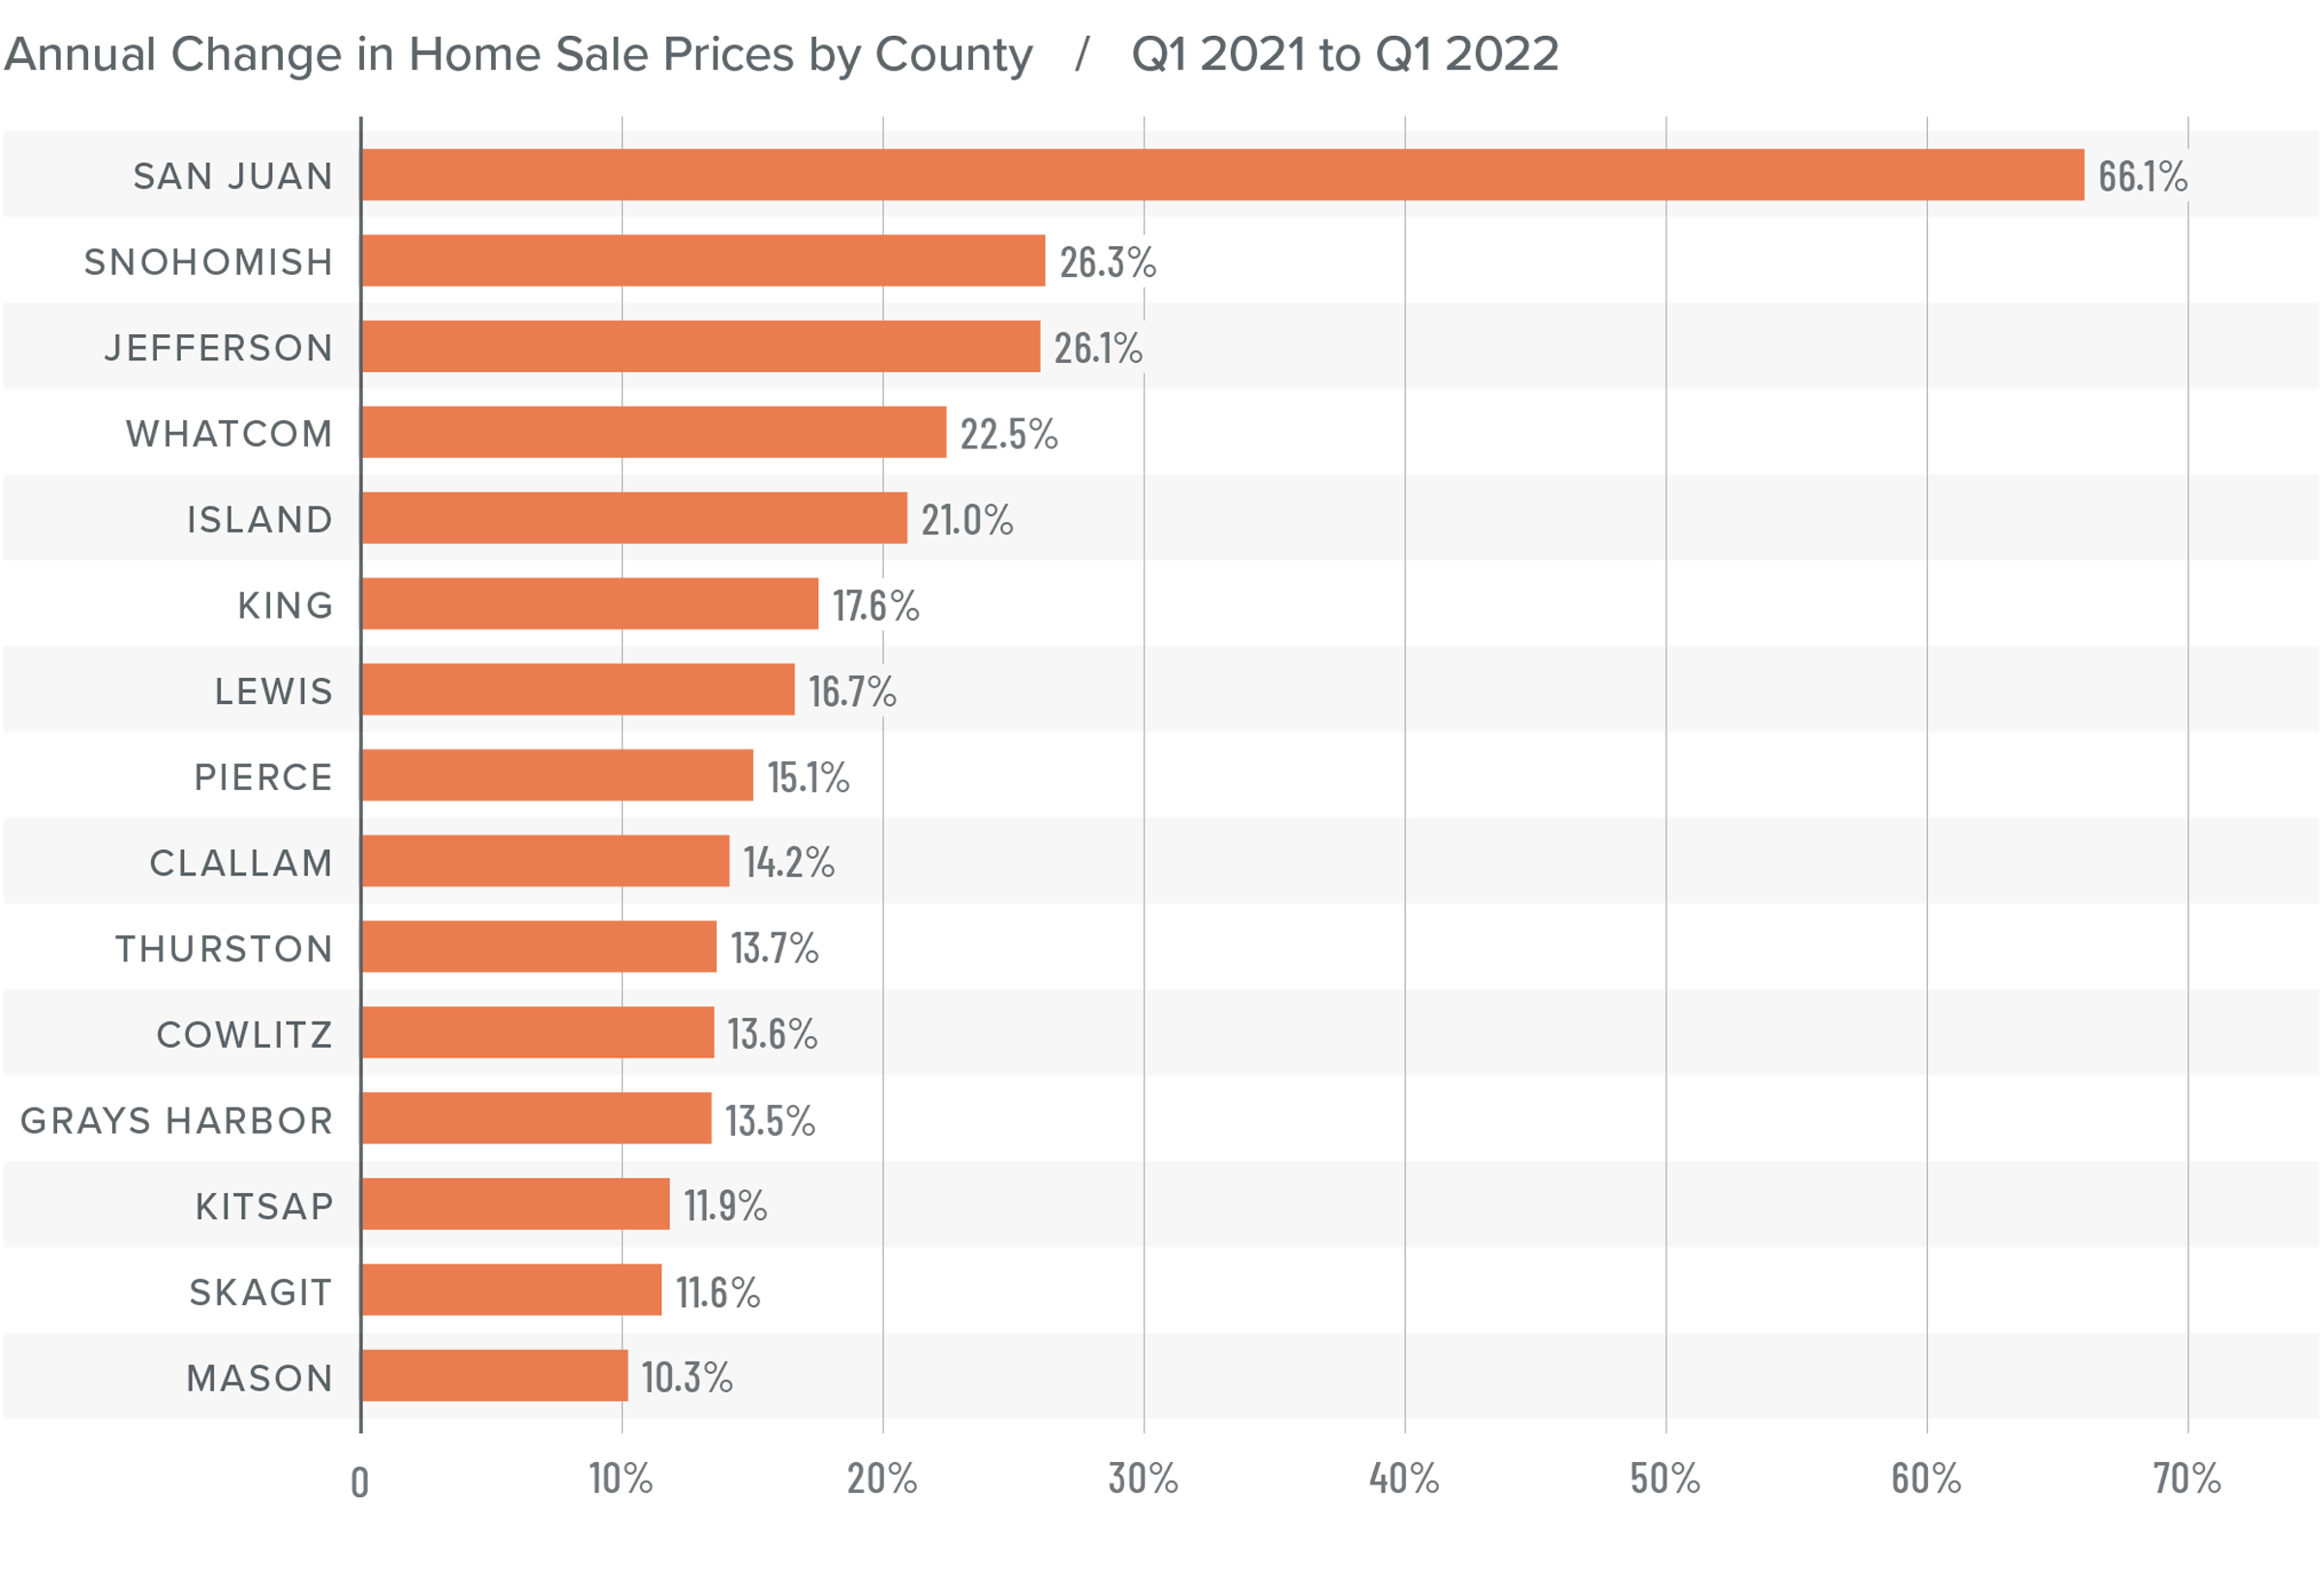
❱ Although financing costs have jumped, this has yet to prove to be an obstacle to buyers, as prices rose 16.4% year-over-year to an average of $738,152. Naturally, there is a lag between rates rising and any impact on market prices. It will be interesting to see what, if any, effect this has in the next quarter’s report.
❱ Compared to the same period a year ago, price growth was again strongest in San Juan County, but all markets saw prices rising more than 10% from a year ago.
❱ Relative to the final quarter of 2021, all but Kitsap (-2.7%), Mason (-1.5%), Skagit (-1.8%), Jefferson (-6.3%), and Clallam (-0.1%) counties saw home prices rise.
❱ The market remains supply starved. While increases in “new” listings suggest that more choice is coming to market, it remains insufficient to meet demand.
Mortgage Rates
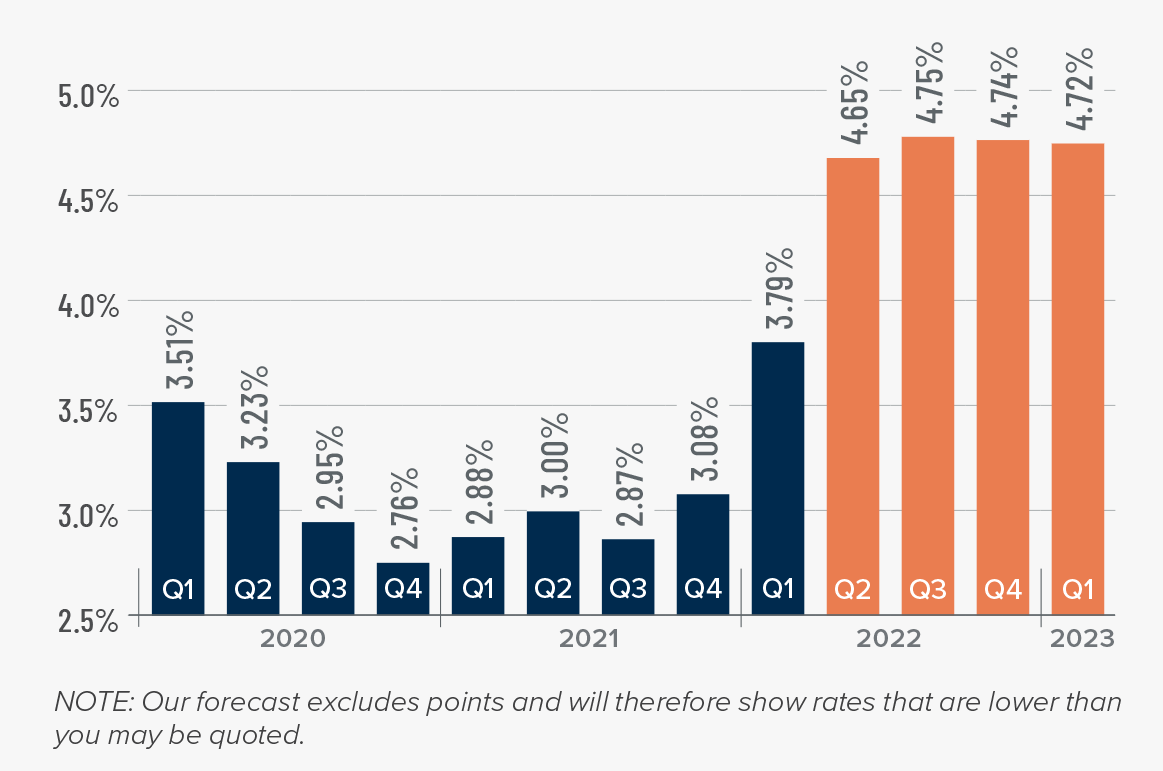
Average rates for a 30-year conforming mortgage were 3.11% at the end of 2021, but since then have jumped over 1.5%—the largest increase since 1987. The surge in rates is because the market is anticipating a seven- to eight-point increase from the Federal Reserve later this year.
Because the mortgage market has priced this into the rates they are offering today, my forecast suggests that we are getting close to a ceiling in rates, and it is my belief that they will rise modestly in the second quarter before stabilizing for the balance of the year.
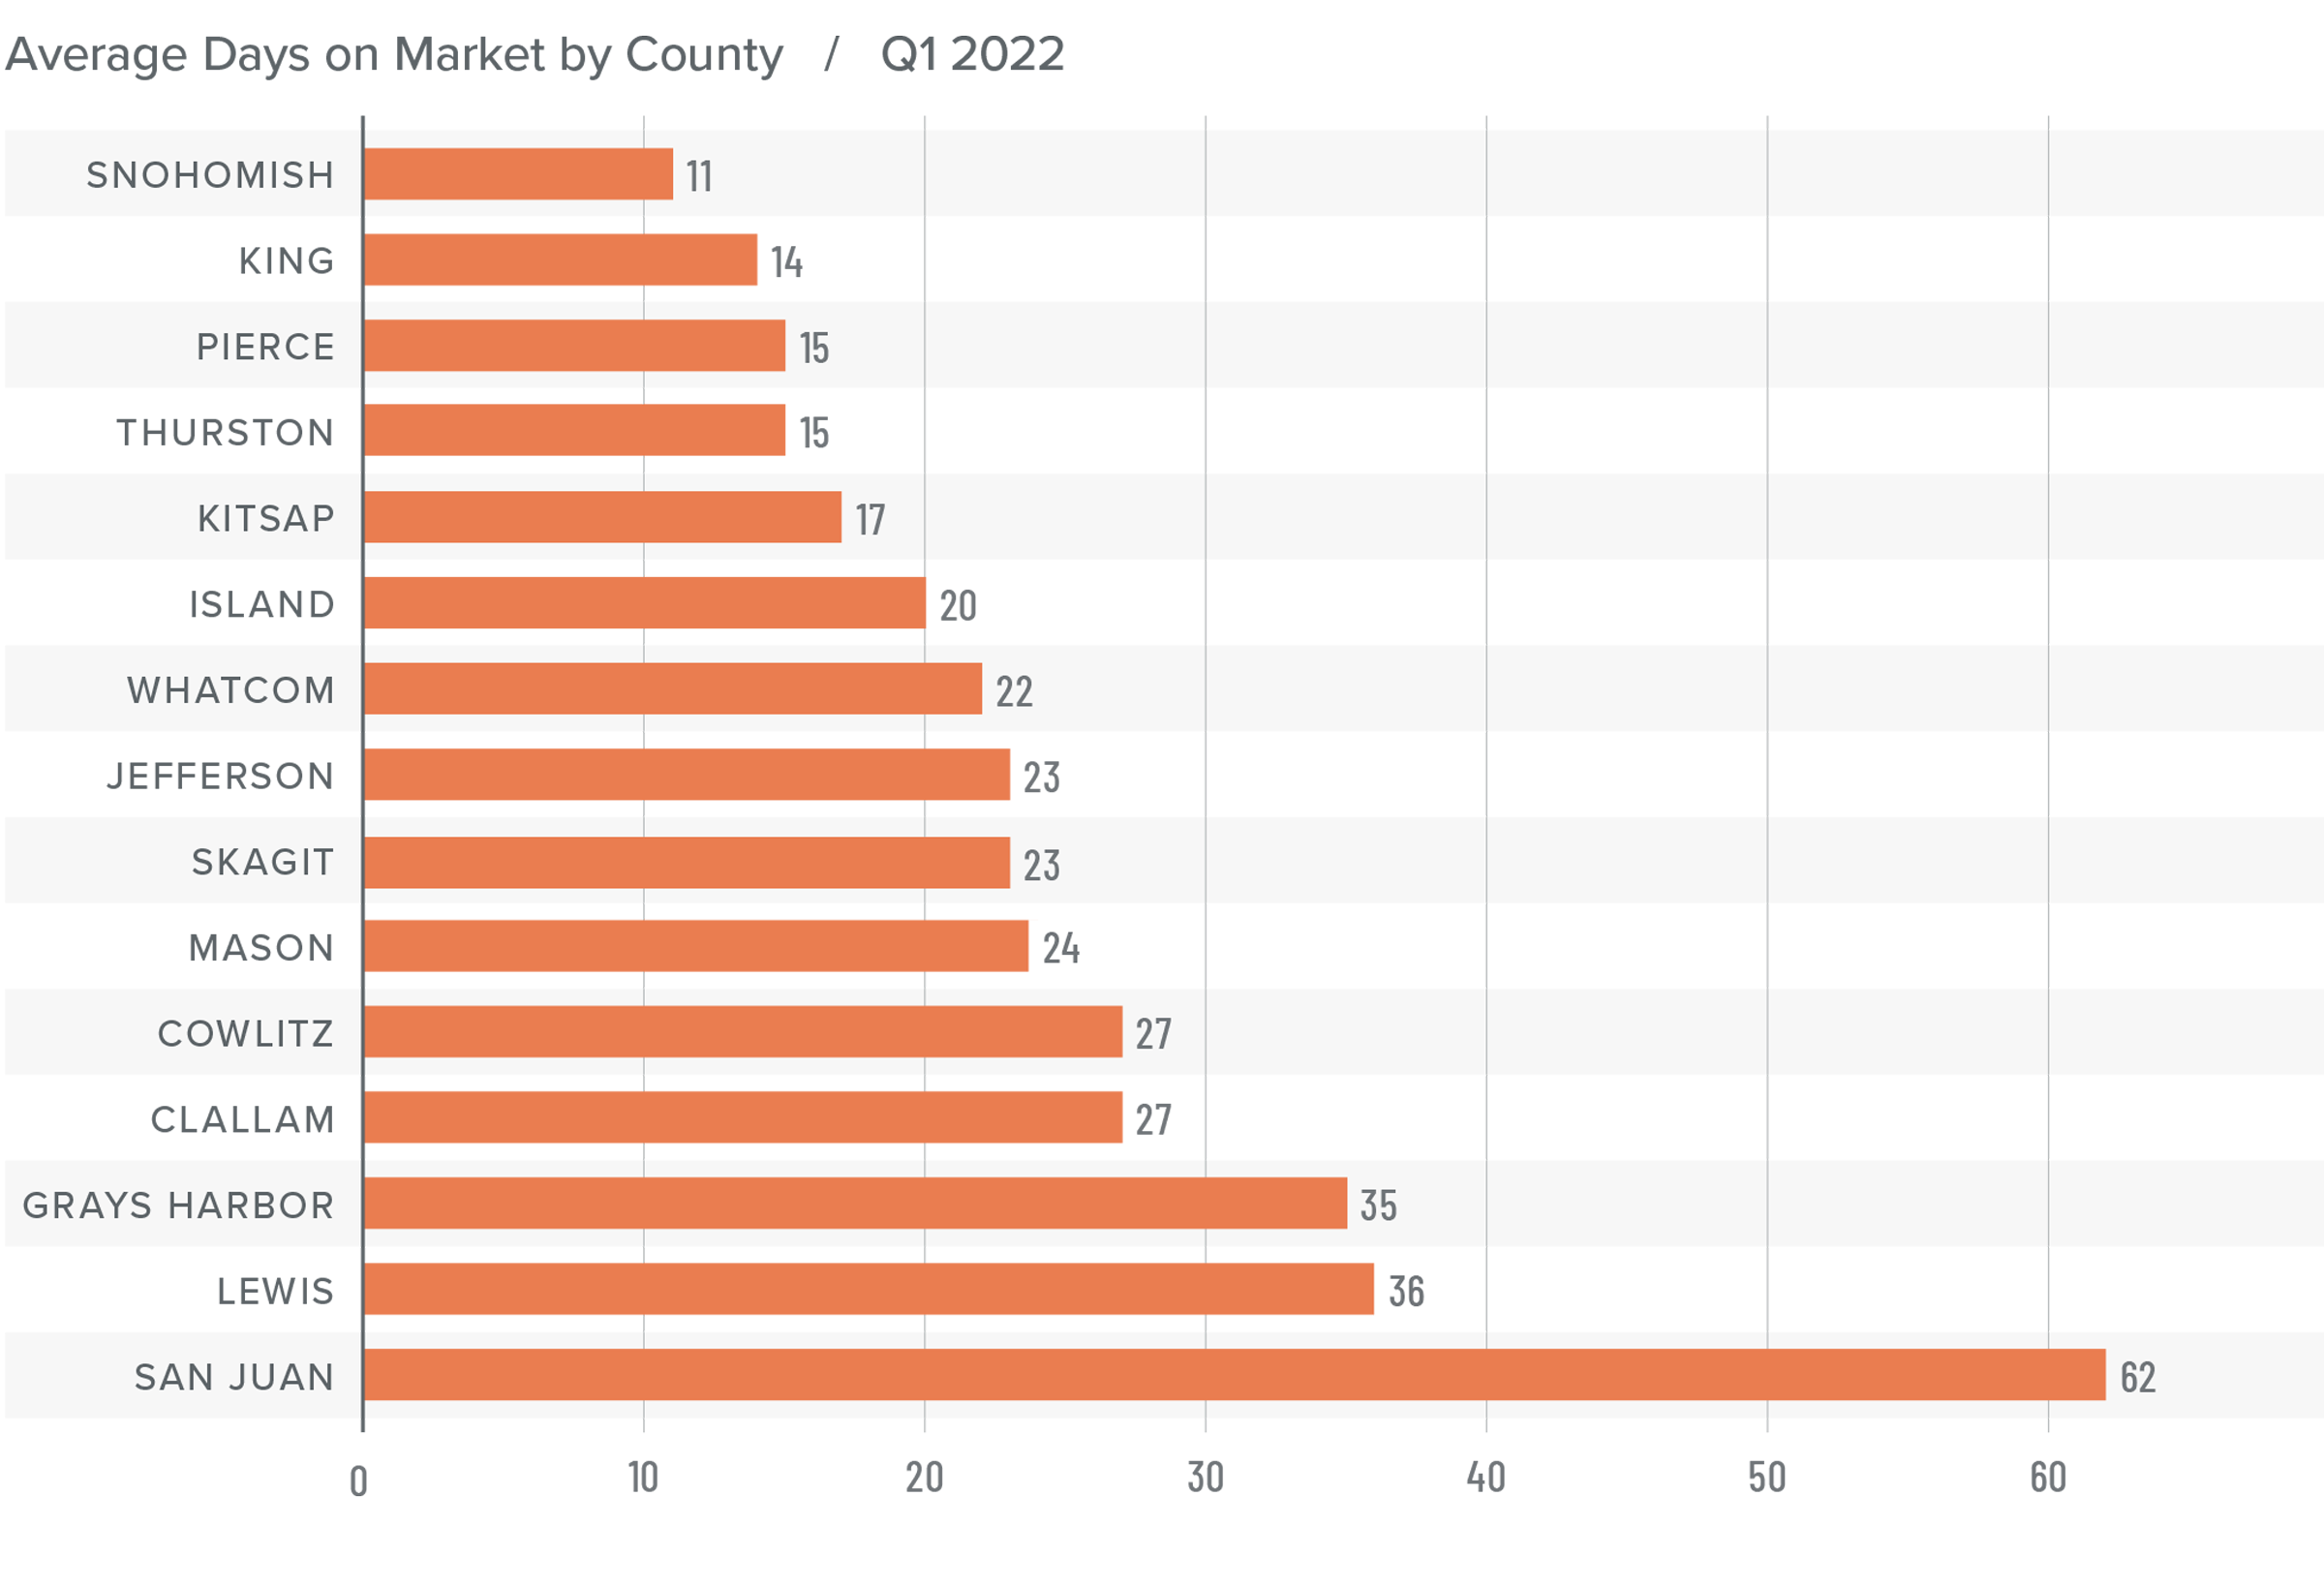
Western Washington Days on Market
❱ It took an average of 25 days for a home to go pending in the first quarter of 2022. This was 4 fewer days than in the same quarter of 2020, but 2 days more than in the fourth quarter of 2021.
❱ Snohomish, King, and Pierce counties were the tightest markets in Western Washington, with homes taking an average of 11 to 15 days to sell. The greatest drop in market time compared to a year ago was in San Juan County, where it took 23 fewer days for homes to sell.
❱ All but five counties saw average time on market drop from the same period a year ago, but the markets where it took longer to sell a home saw the length of time increase only marginally.
❱ Quarter over quarter, market time dropped in Snohomish, King, and Pierce counties. Jefferson and Clallam counties also saw modest improvement. In the balance of the region the length of time a home was on the market rose, but seasonality undoubtedly played a part.
Conclusions
This speedometer reflects the state of the region’s real estate market using housing inventory, price gains, home sales, interest rates, and larger economic factors.
The numbers have yet to indicate that demand is waning amid rising interest rates, but this is sure to become a greater factor as we move into the spring. A leading indicator I pay attention to is changes to list prices and, in most counties, these continue to increase. This suggests that sellers remain confident they will be able to find a buyer even in the face of higher borrowing costs. If this pace of increase starts to soften, it may be an indication of an inflection point, but it does not appear to be that way yet.

Given all the factors discussed above, I have decided to leave the needle in the same position as the last quarter. The market still heavily favors sellers, but if rates rise much further, headwinds will likely increase.
About Matthew Gardner

As Chief Economist for Windermere Real Estate, Matthew Gardner is responsible for analyzing and interpreting economic data and its impact on the real estate market on both a local and national level. Matthew has over 30 years of professional experience both in the U.S. and U.K.
In addition to his day-to-day responsibilities, Matthew sits on the Washington State Governors Council of Economic Advisors; chairs the Board of Trustees at the Washington Center for Real Estate Research at the University of Washington; and is an Advisory Board Member at the Runstad Center for Real Estate Studies at the University of Washington where he also lectures in real estate economics.
